Built 3 projects

Other collectionsProduct & Strategy 3Strategy Decks 1PRD Library 1

Technical build

Cloudflare-cerebro

Turning fragmented feedback into actionable signals.

A deployed feedback-intelligence dashboard that aggregates multi-source feedback and surfaces product-health signals on Cloudflare-native infrastructure.

  • Technical Build
  • Cloudflare
  • D1
  • Workers AI

Open Cloudflare-cerebro (opens in a new tab)View GitHub (opens in a new tab)

Cloudflare services
5
friction points
13
personas
3
deployed product
1
8 sections · 6 original artifacts

The assignment was to build a product that makes that signal usable, on Cloudflare.

  • Support
  • Discord
  • GitHub
  • Email
  • Twitter
  • Forum
  1. Feedback is scattered

    It arrives from Support, Discord, GitHub, email and social or community channels.

  2. Signal is hard to find

    Themes, urgency, value and sentiment have to be pulled out by hand.

  3. One normalized view

    The prototype aggregates every source into a single dashboard.

  4. Trace back to evidence

    Summaries drill down to the individual feedback entries behind them.

The Engineering Lead and Customer Support Manager use the same dashboard to judge severity and spot recurring issues.

Primary persona

Product Manager

Owns product quality and prioritization

Who they are
  • Receives feedback from several fragmented channels
  • Works in weekly reviews, launch windows and incident response
What they want
  • Understand what users are complaining about and why
  • Spot emerging or escalating issues before they become incidents
  • Prioritize on urgency, impact and sentiment, not anecdotes
  • Give engineering leads and leadership concise, evidence-backed insights
What stops them
  • Feedback is noisy, unstructured and spread across tools
  • Urgency and trend changes are hard to quantify
  • Manual weekly synthesis is slow and error-prone
  • High-level insights are hard to trace back to raw customer evidence
Secondary persona

Engineering Lead

Owns system reliability and technical quality

Who they are
  • Assesses the severity and impact of user-reported issues
  • Interrupted by on-call rotations and incidents
What they want
  • Concrete issue severity
  • Reproducible examples
  • Technical context to decide what needs attention now
What stops them
  • Chasing low-signal tickets

Secondary persona

Customer Support Manager

Owns response SLAs and ticket resolution

Who they are
  • Works under high ticket volume and operational pressure
  • Identifies recurring issues and source patterns
What they want
  • Recurring-issue detection
  • Source patterns
  • Escalation signals
What stops them
  • Escalations from unresolved systemic issues

Seven product surfaces. Real screenshots of each appear in the deployed-product walkthrough below.

  • Multi-source aggregationFeedback from every channel normalized into one view, filterable by source and time range.
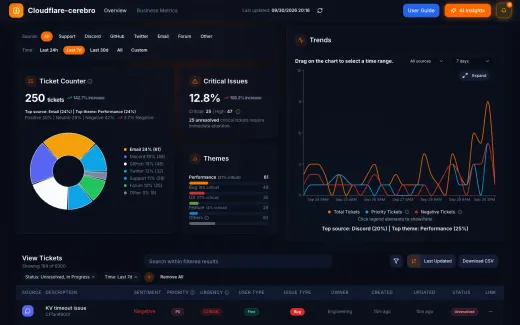
  • Triage overviewA KPI strip, ticket counter, critical-issue share, theme breakdown and trend chart for the current window.
  • AI InsightsAn overlay of emerging issues and summary insights, labelled with whether it came from AI or a fallback.
  • Needs AttentionAn overlay of unresolved critical issues with owner, theme and how long each has been open.
  • Search, filter and drill-downFilter and search the ticket table, then open any ticket to see its full detail.
  • Business MetricsLongitudinal product-health signals: high-priority open, negative feedback trend, resolution time and escalating themes.
  • Exportable outputDownload the filtered ticket table as CSV.

The prototype is a serverless JAMstack app: a Pages frontend, Pages Functions as the API layer, D1 for storage, Workers AI for insights and KV as a cache. Components are labelled by whether they exist in the prototype or only in the design analysis.

  1. Mock input

    Synthetic feedback; no real integrations.

    • Synthetic feedback datasetClient

      Implemented in the prototype

      About 6,000 generated records across Support, Discord, GitHub, Email, Twitter and Forum.

  2. Presentation

    The dashboard users see.

    • Pages: React dashboardClient

      Implemented in the prototype

      Routes for Overview, Business Metrics and the user guide; filtering and aggregation run in the browser.

  3. Execution

    Serverless API routes beside the frontend.

    • /api/feedbackService

      Implemented in the prototype

      Pages Function returning stored feedback entries.

    • /api/insightsService

      Implemented in the prototype

      Pages Function that builds the AI Insights overlay.

  4. Data & intelligence

    Storage, AI and caching.

    • D1Data store

      Implemented in the prototype

      Structured system of record for feedback entries.

    • Workers AIService

      Implemented in the prototype

      Generates insight summaries; the endpoint falls back to rule-based summaries when the call fails.

    • KVData store

      Implemented in the prototype

      Caches AI-generated insights for one hour. D1 stays the source of truth.

  5. Proposed / evaluated

    In the design analysis, not in the prototype.

    • Cloudflare WorkflowsQueue

      Proposed / evaluated

      Asynchronous ingestion-to-analysis orchestration from the design doc. The prototype has no Workflows binding.

    • AI classification at ingestService

      Proposed / evaluated

      Sentiment, urgency and themes assigned by Workers AI as feedback arrives. In the prototype these come from fixed enumerations in the mock data.

    • Server-side aggregationService

      Proposed / evaluated

      Would replace client-side filtering as data grows beyond the current bounded dataset.

Component choices

Cloudflare Pages

Hosts the React frontend and its Pages Functions.

Why chosen
It minimizes integration friction: frontend, APIs, AI and database run in one ecosystem, and Pages Functions call backend logic without cross-platform networking or auth.
Trade-off
Limited UI visibility into what Functions are doing, compared with Vercel's deployment previews.
What I learned
A Functions visibility panel and a local dev mode with hot reload for Functions would close the iteration-speed gap.

Workers / Pages Functions

The execution and API layer between the dashboard and the data.

Why chosen
Edge-first execution, direct bindings to D1, KV and Workers AI without SDKs or credentials, and one execution layer for a PM-built prototype.
Trade-off
Execution constraints, such as Pages Functions time limits, in exchange for zero infrastructure management.
What I learned
Endpoint-level latency and error visibility, plus pre-deployment validation of bindings, would have caught misconfiguration earlier.

D1

Structured storage for feedback entries.

Why chosen
The data is structured and analytics-heavy, so SQL querying, tight Worker integration and no database operations suited a prototype.
Trade-off
Eventual consistency across replicas, and less portability outside the Cloudflare ecosystem.
What I learned
Seeding about 6,000 rows exposed opaque limits. Limit transparency and data-quality checks became the PRD.

Workers AI

Generates the AI Insights summaries.

Why chosen
Inference runs next to the Worker, needs no API keys or IAM roles, and fits the existing Pages, Functions and D1 stack.
Trade-off
A curated model catalog and limited cost transparency, compared with broader external providers.
What I learned
There was no easy way to tell whether the AI was running or the endpoint had fallen back, which is why the overlay labels its source.

KV

Caches derived AI insights; not a system of record.

Why chosen
The access pattern is read-heavy and repetitive, tolerates short staleness, and needs no cache cluster to manage.
Trade-off
Eventual consistency and a minimum TTL, in exchange for edge-fast repeat reads.
What I learned
KV returns null for an empty cache, an error and an uninitialized namespace alike, so cache state is hard to debug.

Design principles

  • Cloudflare-native by defaultEvery architectural component maps to a Cloudflare product capability, minimizing external dependencies.
  • Separation of concernsIngestion, analysis, storage and presentation are decoupled for simpler debugging and faster iteration.
  • Explainability over black-box AIInsights should trace back to underlying feedback entries so decisions stay transparent and trusted.

Trade-offs

Deliberate decisions for a prototype, each with what it bought and what it gave up.

Serverless, edge-first

Serverless was chosen to maximize development speed and operational simplicity for a dashboard-style workload.

Benefit
Zero infrastructure management and automatic scaling.
Cost
Execution constraints such as Pages Functions time limits, and possible cold starts, largely mitigated by the global edge.

D1 for storage

D1 was selected for SQL familiarity, low operational overhead and suitability for structured, query-heavy analytics.

Benefit
Simplicity and tight platform integration.
Cost
Eventual consistency across replicas, and less portability outside Cloudflare.

Mock data over real integrations

Mock data allowed faster iteration and clearer evaluation of the product insights; real integrations are deferred.

Benefit
Rapid prototyping and controlled test scenarios.
Cost
No production-grade ingestion, and real-world data variability is untested.

Client-side filtering and aggregation

Filtering in the browser keeps the UI instant at the current scale of under 10K entries; server-side aggregation can follow as volume grows.

Benefit
Instant responsiveness and fewer server round-trips.
Cost
A bounded dataset must load into the browser, increasing client memory use.

No authentication

Authentication was deliberately deferred to focus on the core feedback intelligence. It is required for any production deployment.

Benefit
Faster setup.
Cost
No access control or security.

From overview to drill-down

Open Cloudflare-cerebro (opens in a new tab)

1 / 5

Step 01

Overview

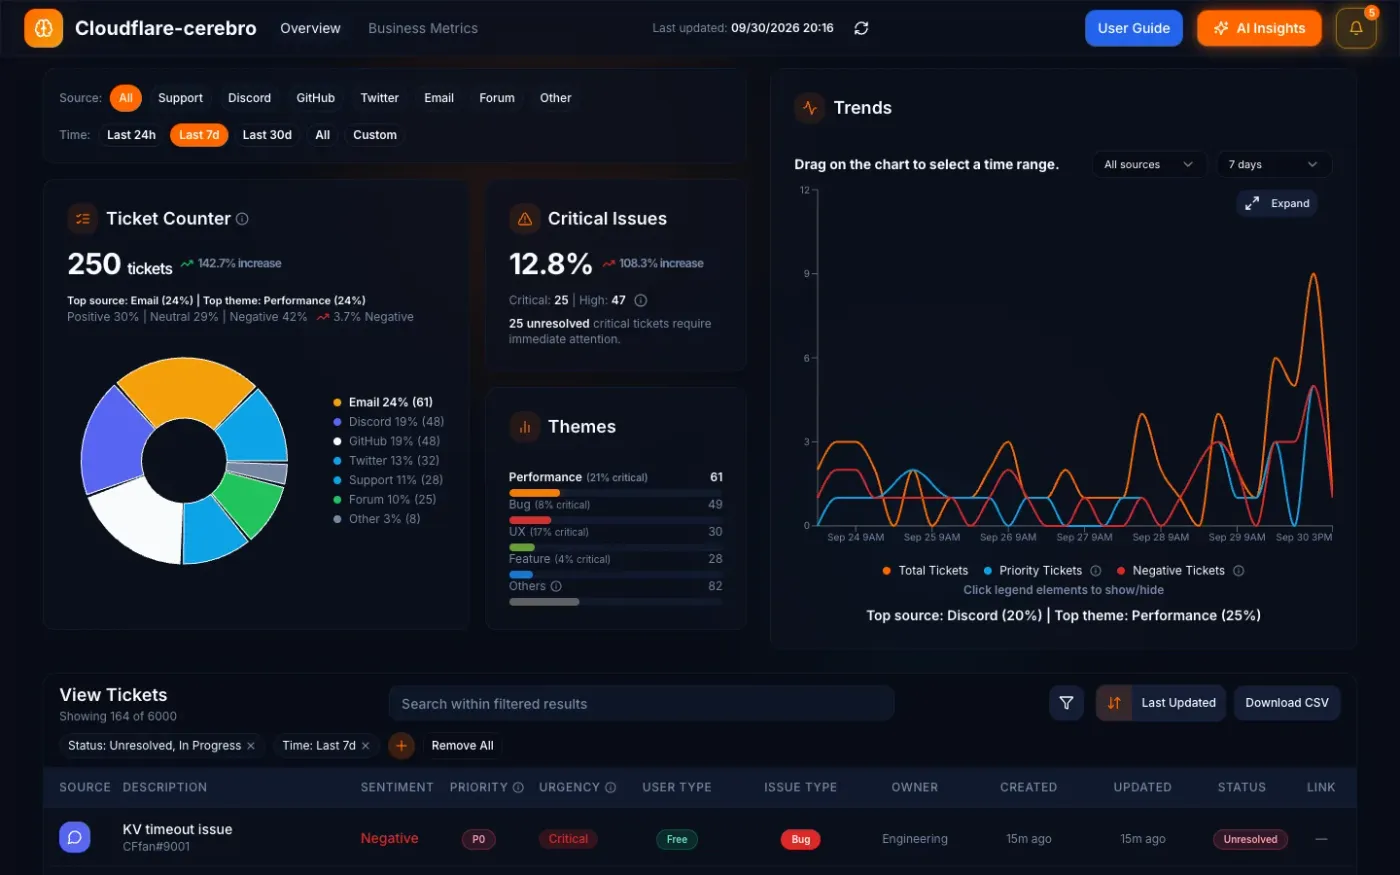
Source and time filters sit above a ticket counter, the critical-issue share, a theme breakdown and a trend chart, with the filterable ticket table below.

  • FiltersBy source and by time range
  • At a glanceTicket counter, critical share, themes, trend
  • Ticket tableShowing 164 of 6000 mock records

Building the prototype produced 13 documented friction points, grouped below. The five highest-ranked by the log's own RICE prioritization are the P0 group: they are about trust and first-time success, not missing features.

  • D1 transparency2 issues · Opaque rate limits; no data validation
  • Pages Functions execution and configuration3 issues · Execution model, silent failures, hidden config
  • Local development2 issues · Slow iteration loop; no local Workers AI
  • CLI and error guidance1 issue · Errors that suggest no fix
  • Workers AI observability2 issues · Can't verify it runs; ambiguous binding
  • KV observability3 issues · Config visibility, inspection, empty vs error

Top five by RICE

#1D1P0RICE 11.25

D1 rate limits are opaque and errors are non-actionable

Problem
Seeding about 6,000 rows failed with “Too many API requests by single worker invocation”, without the limit, the attempted count, or whether it was per invocation or per time window.
Impact
Time lost to trial and error; a working batch size of about 40 statements was found by experiment.
Suggestion
Document the limits, include attempted versus allowed in the error, and surface constraints in the CLI.

#2Pages FunctionsP0RICE 11.25

Pages Functions fail silently and fall back to HTML

Problem
When Functions failed or were not configured, API calls returned HTML 404 pages instead of JSON errors, with no signal whether the Function was undeployed, crashed or misrouted.
Impact
Hard frontend debugging and no reliable sign that Functions were running.
Suggestion
Always return JSON errors, even on 404 or 500, and surface Function errors in the Pages dashboard.

#3Pages FunctionsP0RICE 10.63

Functions configuration is hidden and hard to verify

Problem
After deploying through GitHub, Functions did not run because the Functions directory was misconfigured. The setting sat deep in the dashboard and was not validated or logged at deploy.
Impact
Deploys succeeded while Functions were effectively broken.
Suggestion
Show Functions status, directory and detected Functions in the dashboard, and validate before deploy.

#4Workers AIP0RICE 8.50

No way to verify that Workers AI is working

Problem
There was no clear way to confirm the AI binding was configured, whether output was AI or a fallback, or which model was in use.
Impact
Users cannot trust whether insights are AI-generated, and debugging becomes guesswork.
Suggestion
Add an AI status endpoint and UI indicator, with explicit AI-versus-fallback labels.

#5Workers AIP0RICE 8.50

Workers AI binding configuration is ambiguous

Problem
wrangler.toml says bindings are managed in code, the dashboard disables “Add binding”, and there is no way to confirm the binding is active.
Impact
Failures surface only at runtime, and time went to dashboard configuration that was not needed.
Suggestion
Say in the dashboard that bindings come from wrangler.toml, add a bindings list command, and warn before deploy.
Read the full Friction Log

PRD: D1 Observability Improvement

Developers using D1 meet opaque rate limits and non-actionable errors, especially in bulk operations such as seeding and migrations. The opportunity is to make limits explicit and actionable without changing the underlying constraints.

Why it matters

  • Transparency raises developer confidence, which supports adoption of D1 for analytics and production workloads.
  • Clear, actionable feedback cuts trial and error and speeds development.
  • Faster time to success and fewer blockers improve satisfaction and retention across Pages, Workers and D1.

Key assumptions

  • Developers regularly run bulk operations, where limits are hit most often.
  • The core problem is lack of visibility and guidance, not the existence of limits.
  • Developers will change their behavior if errors are clear and actionable.

Solution directions

Prioritized with the DHM model: Delight, Hard to copy, Margin moving.

D1 limit awareness and preflight validation

High priority

A preflight layer in the CLI and API to query current limits and validate bulk operations before running them, through commands like wrangler d1 limits or wrangler d1 validate.

  • Opaque rate limits made explicit
  • Fewer trial-and-error seeds and migrations
  • Predictable development without changing limits
Delight
High
Hard to copy
High
Margin moving
Medium

Actionable, context-rich error responses

High priority

Errors that carry attempted versus allowed counts, a plain explanation and a fix, for example “Reduce batch size to ≤40 statements”.

  • Non-actionable errors become guided fixes
  • Less debugging time and fewer repeated failures
  • Trust from clear reasons for failure
Delight
High
Hard to copy
Medium
Margin moving
High

Opinionated bulk-operation patterns and tooling

Medium priority

First-class workflows for seeding, migrations and analytics ingestion, with reference implementations, batching helpers and retry strategies.

  • Less misuse of D1 in bulk scenarios
  • Developer behavior aligned with platform limits
  • Lower onboarding friction
Delight
Medium
Hard to copy
Low
Margin moving
Low

Roadmap

  1. Planning and preparation
  2. Design and specification
  3. Development and prototyping
  4. Testing and iteration
  5. Launch and initial rollout
  6. Optimization and scaling
Read the full PRD

Original artifacts6

The live product, the source and every document behind this page, unedited.

Next in Built · 2 of 3Togetherwork Ops AIAn AI-assisted operations prototype spanning support triage, implementation workflows, knowledge management and analytics.Next project

Sections 8

Original artifacts6