Product & Strategy 8 projects

Other collectionsBuilt 3Claude in Daily Life 2Strategy Decks 2PRD Library 5

Wireframes · sample values

Product case study

Dream11 ML Platform

An in-house ML platform, pitched to management.

My Dream11 interview case, written before I joined: an investment pitch for building an in-house ML platform. I made the build-or-buy case, scored 26 sub-features into three releases, costed v1, and drew the system and its console.

  • Product Strategy
  • ML Platform
  • Build vs Buy
  • Prioritization
  • Wireframes
user interviews
10
user groups
5
sub-features scored
26
releases planned
3
9 sections · 3 original artifacts

Brief

As givenDream11, India's leading fantasy sports platform, aims to build a robust ML platform to enhance its machine-learning capabilities. Create an investment pitch deck for Dream11 management, highlighting the platform's vision, potential impact, and execution strategy to convince them of the idea and the execution plan.

Q3 · users

Data scientists use it, management buys it

Primary users are data scientists; the buyer and approver is management. A high-frequency, high-usage product.
Q7 · scope

The entire ML lifecycle

The one answer on which use cases the platform must cover.

Q4 to Q6 · unknowns

Assume, and declare it

Existing in-house solutions, technical and cost constraints and the v1 timeline are left to the case: take assumptions and state them.

Q1, Q2 · format

A deck, as long as it needs

PPT format. Keep it relevant; the length is up to the author.

Where this comes fromI wrote this deck in January 2025 for my Dream11 interview, before I joined as a Product Manager that February. What I worked on in the role is on the Career page.
Purpose

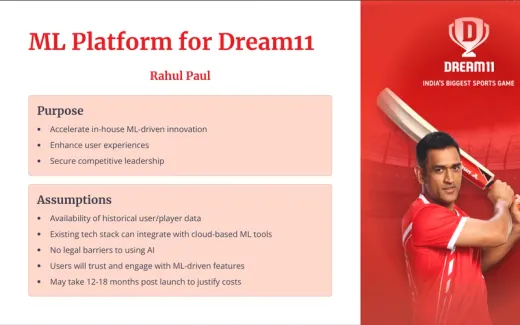
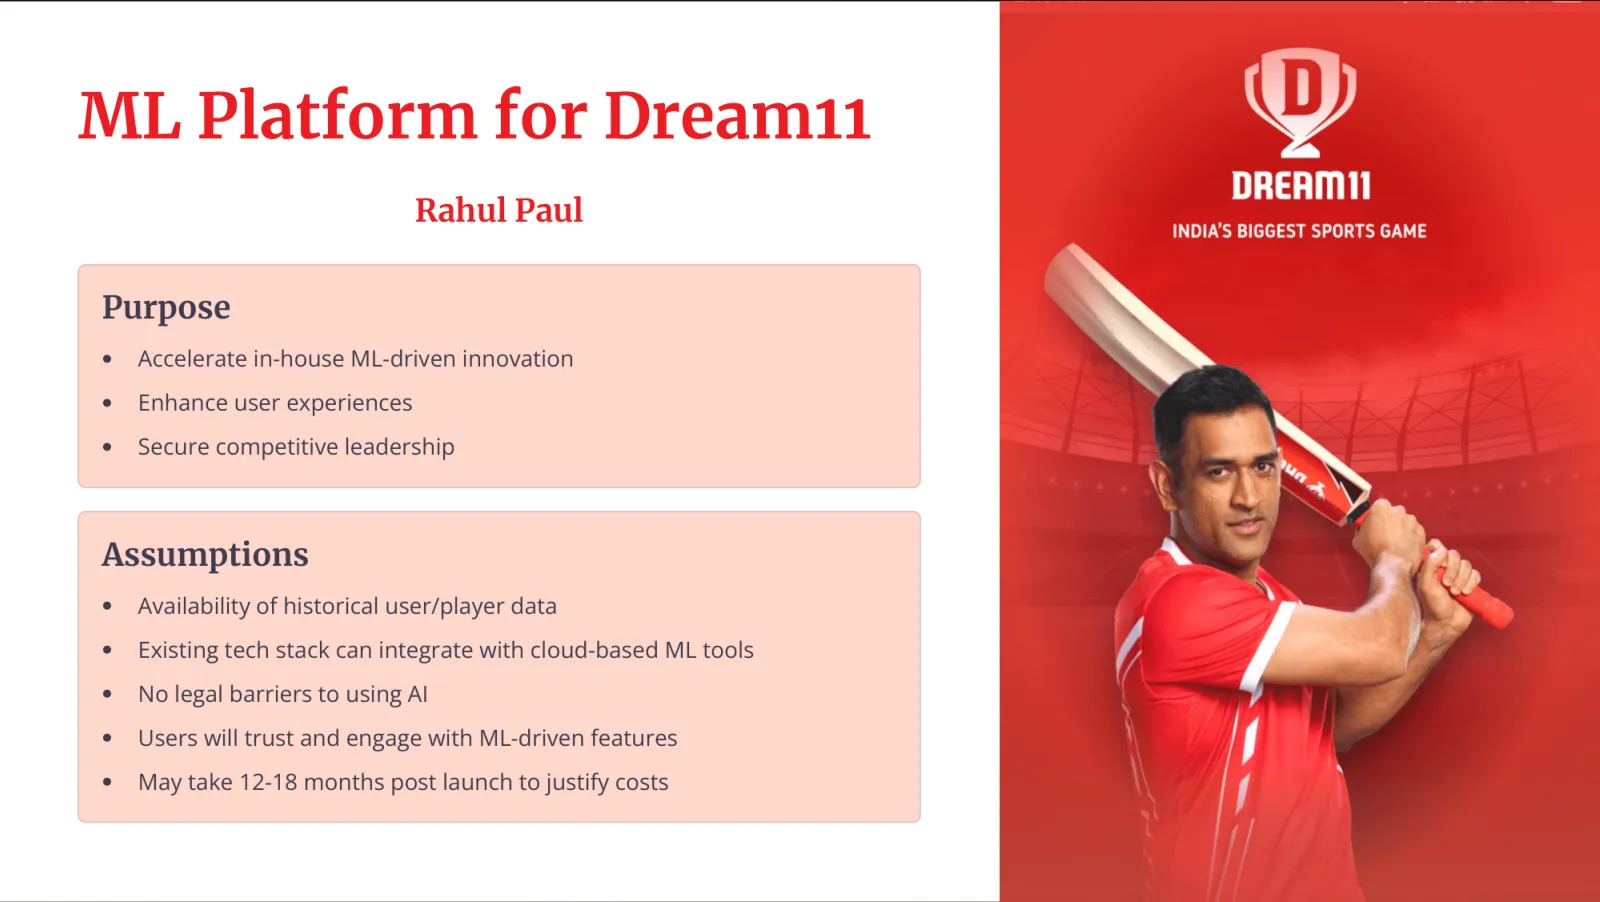
Slide 1, ML Platform for Dream11, Rahul Paul. Purpose: accelerate in-house ML-driven innovation, enhance user experiences, secure competitive leadership. Assumptions: availability of historical user and player data; the existing tech stack can integrate with cloud-based ML tools; no legal barriers to using AI; users will trust and engage with ML-driven features; it may take 12 to 18 months post launch to justify costs. The right third of the slide is a Dream11 promotional image on red: the Dream11 logo, the line India's biggest sports game, and a cricketer in a red kit holding a bat.
Slide 1Open in deck (opens in a new tab)

Why a platform

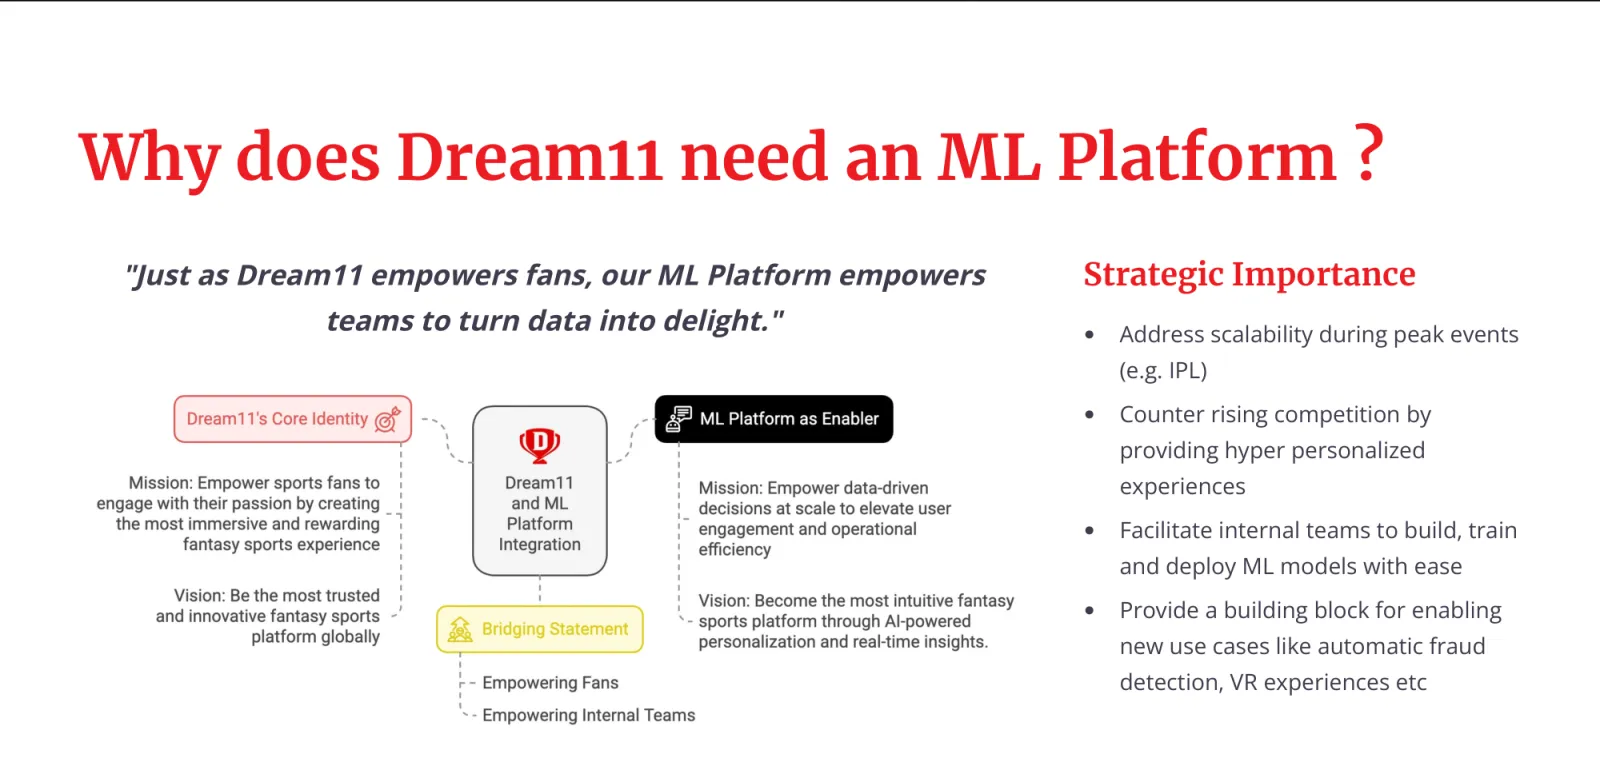
Slide 2, Why does Dream11 need an ML Platform? Quote: just as Dream11 empowers fans, our ML Platform empowers teams to turn data into delight. A diagram joins Dream11's core identity (mission: empower sports fans to engage with their passion by creating the most immersive and rewarding fantasy sports experience; vision: be the most trusted and innovative fantasy sports platform globally) to the ML Platform as enabler (mission: empower data-driven decisions at scale to elevate user engagement and operational efficiency; vision: become the most intuitive fantasy sports platform through AI-powered personalization and real-time insights) through a bridging statement: empowering fans, empowering internal teams. Strategic importance: address scalability during peak events such as the IPL; counter rising competition by providing hyper personalized experiences; facilitate internal teams to build, train and deploy ML models with ease; provide a building block for new use cases like automatic fraud detection and VR experiences.
Slide 2Open in deck (opens in a new tab)

Market gaps

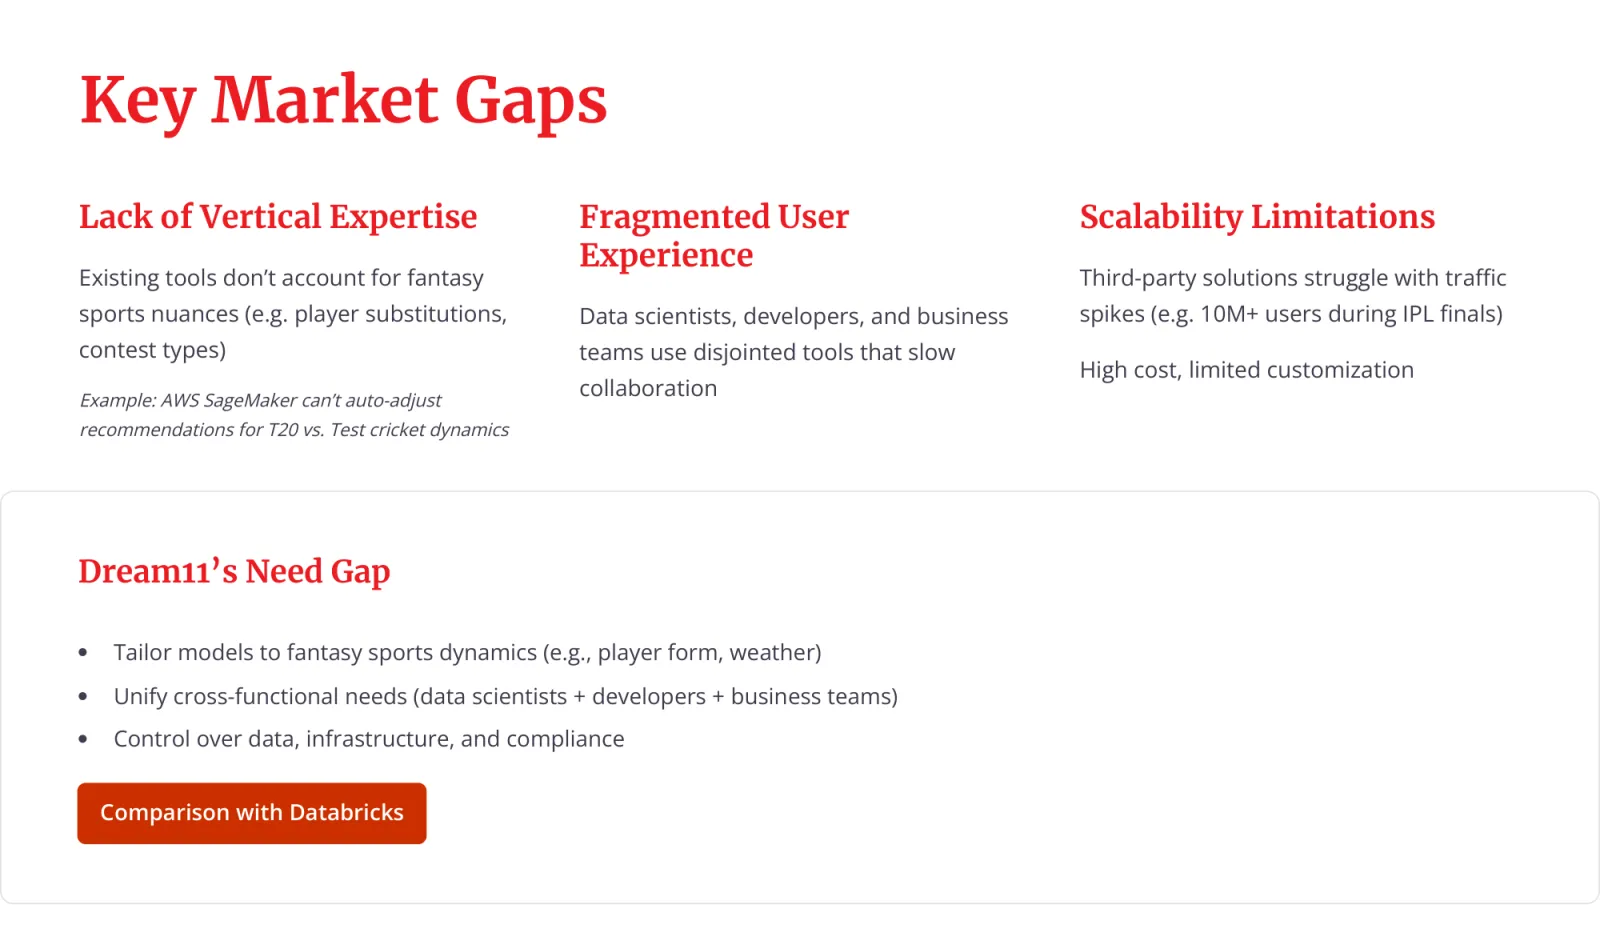
Slide 4, Key Market Gaps. Lack of vertical expertise: existing tools do not account for fantasy sports nuances such as player substitutions and contest types; example, AWS SageMaker cannot auto-adjust recommendations for T20 versus Test cricket dynamics. Fragmented user experience: data scientists, developers and business teams use disjointed tools that slow collaboration. Scalability limitations: third-party solutions struggle with traffic spikes such as 10M plus users during IPL finals; high cost, limited customization. Dream11's need gap: tailor models to fantasy sports dynamics such as player form and weather; unify cross-functional needs of data scientists, developers and business teams; control over data, infrastructure and compliance. A button links to the comparison with Databricks.
Slide 4Open in deck (opens in a new tab)

Constraints

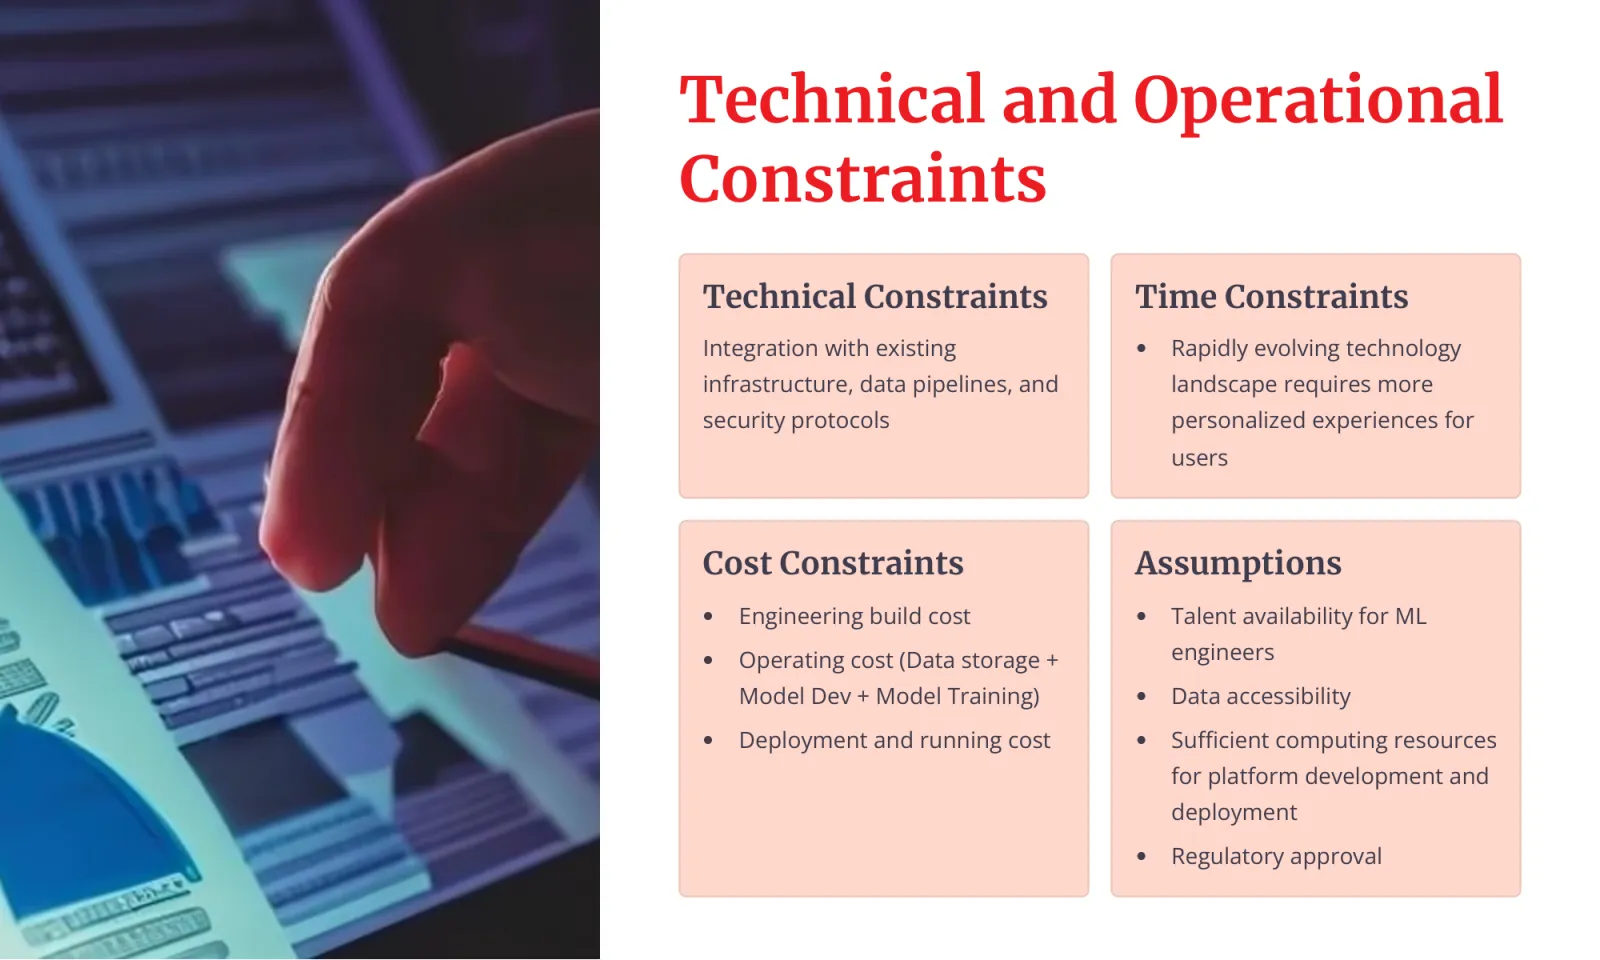
Slide 6, Technical and Operational Constraints, beside a photograph of a hand pointing a pen at charts on a screen. Technical constraints: integration with existing infrastructure, data pipelines and security protocols. Time constraints: a rapidly evolving technology landscape requires more personalized experiences for users. Cost constraints: engineering build cost; operating cost of data storage, model development and model training; deployment and running cost. Assumptions: talent availability for ML engineers; data accessibility; sufficient computing resources for platform development and deployment; regulatory approval.
Slide 6Open in deck (opens in a new tab)

The ideaAn in-house ML platform for Dream11's data scientists: one system from ingestion to serving, with a build-or-buy case, a console and a phased roadmap. A pitch, not a product.

01

Started from the brief's gaps

Seven clarifying answers set the users, the buyer and what the pitch had to assume.

The brief

02

For the people who build models

Five user groups on the slide, four of them profiled from interviews with 10 people, so the platform starts from real jobs.

Who it is for

03

Build, not buy

Eight parameters, a Databricks comparison and a v1 guesstimate make the case for in-house. The costs are guesses, not Dream11's figures.

Build or buy

04

One lifecycle, drawn as a system

8 layers, from ingestion and storage to serving, monitoring and security, joined into one architecture.

The platform

05

A console to run it

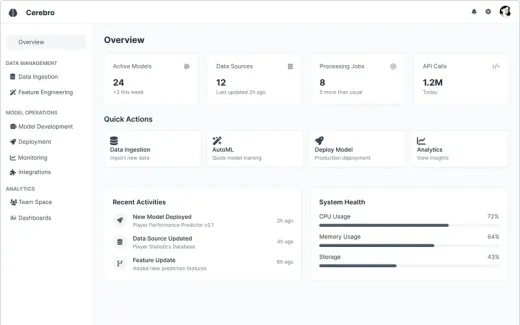
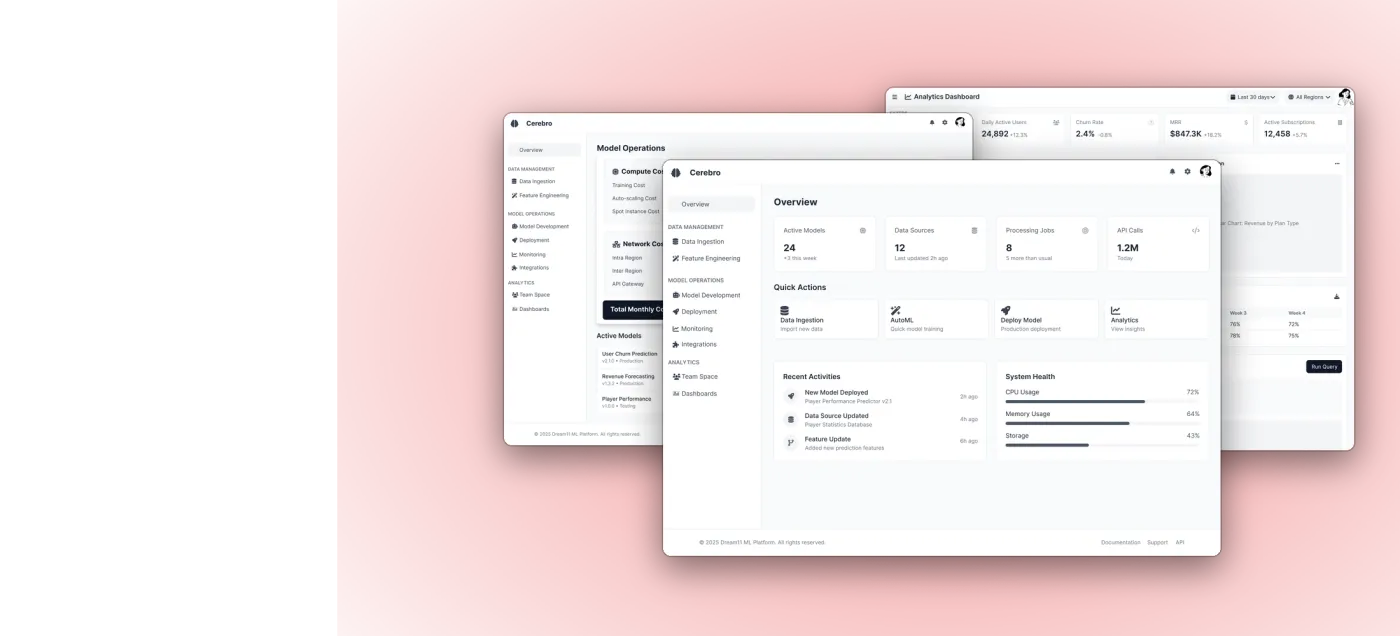
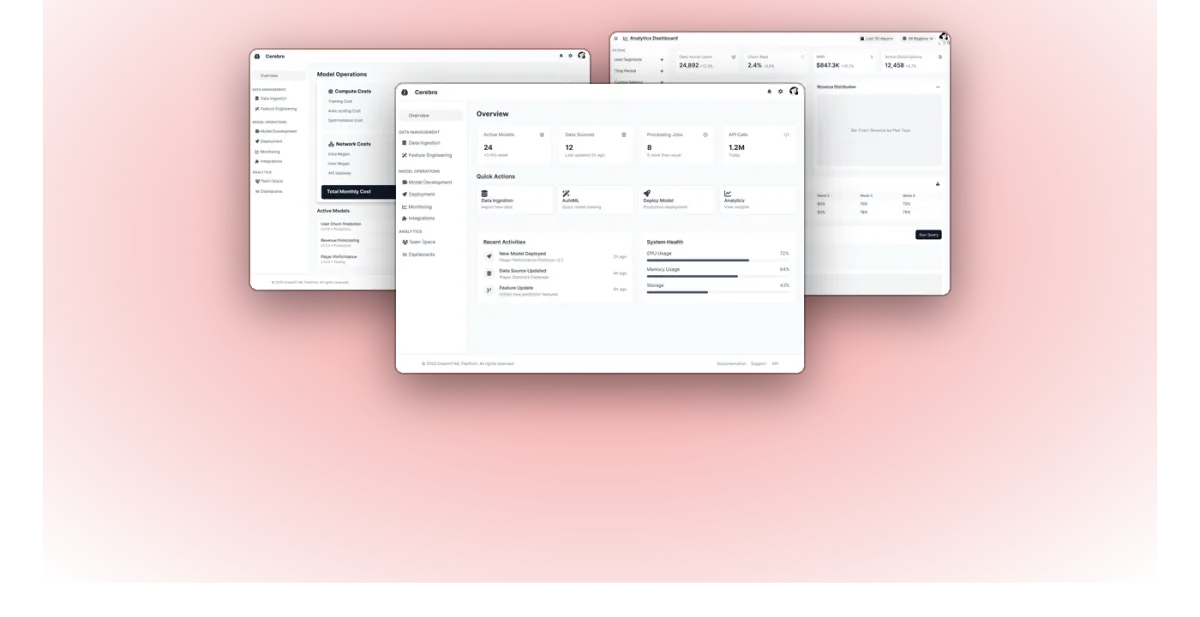
Three wireframed screens for the console, Cerebro: an overview, model operations and analytics.

The wireframes

06

Scored, phased and measured

26 sub-features scored on four parameters and sorted into V1 to V3. The north star is proposed, never measured.

The roadmap

Overview, model operations, analytics

Every figure on the screens is a placeholder the wireframe was drawn with.

Open in Figma (opens in a new tab)

1 / 3

Step 01

Overview

The landing screen: four counters, four quick actions, recent activity and system health. The numbers are placeholders.

  • MenuData management, model operations and analytics
  • CountersActive models, data sources, processing jobs, API calls
  • Quick actionsData ingestion, AutoML, deploy model, analytics

Jobs to be done

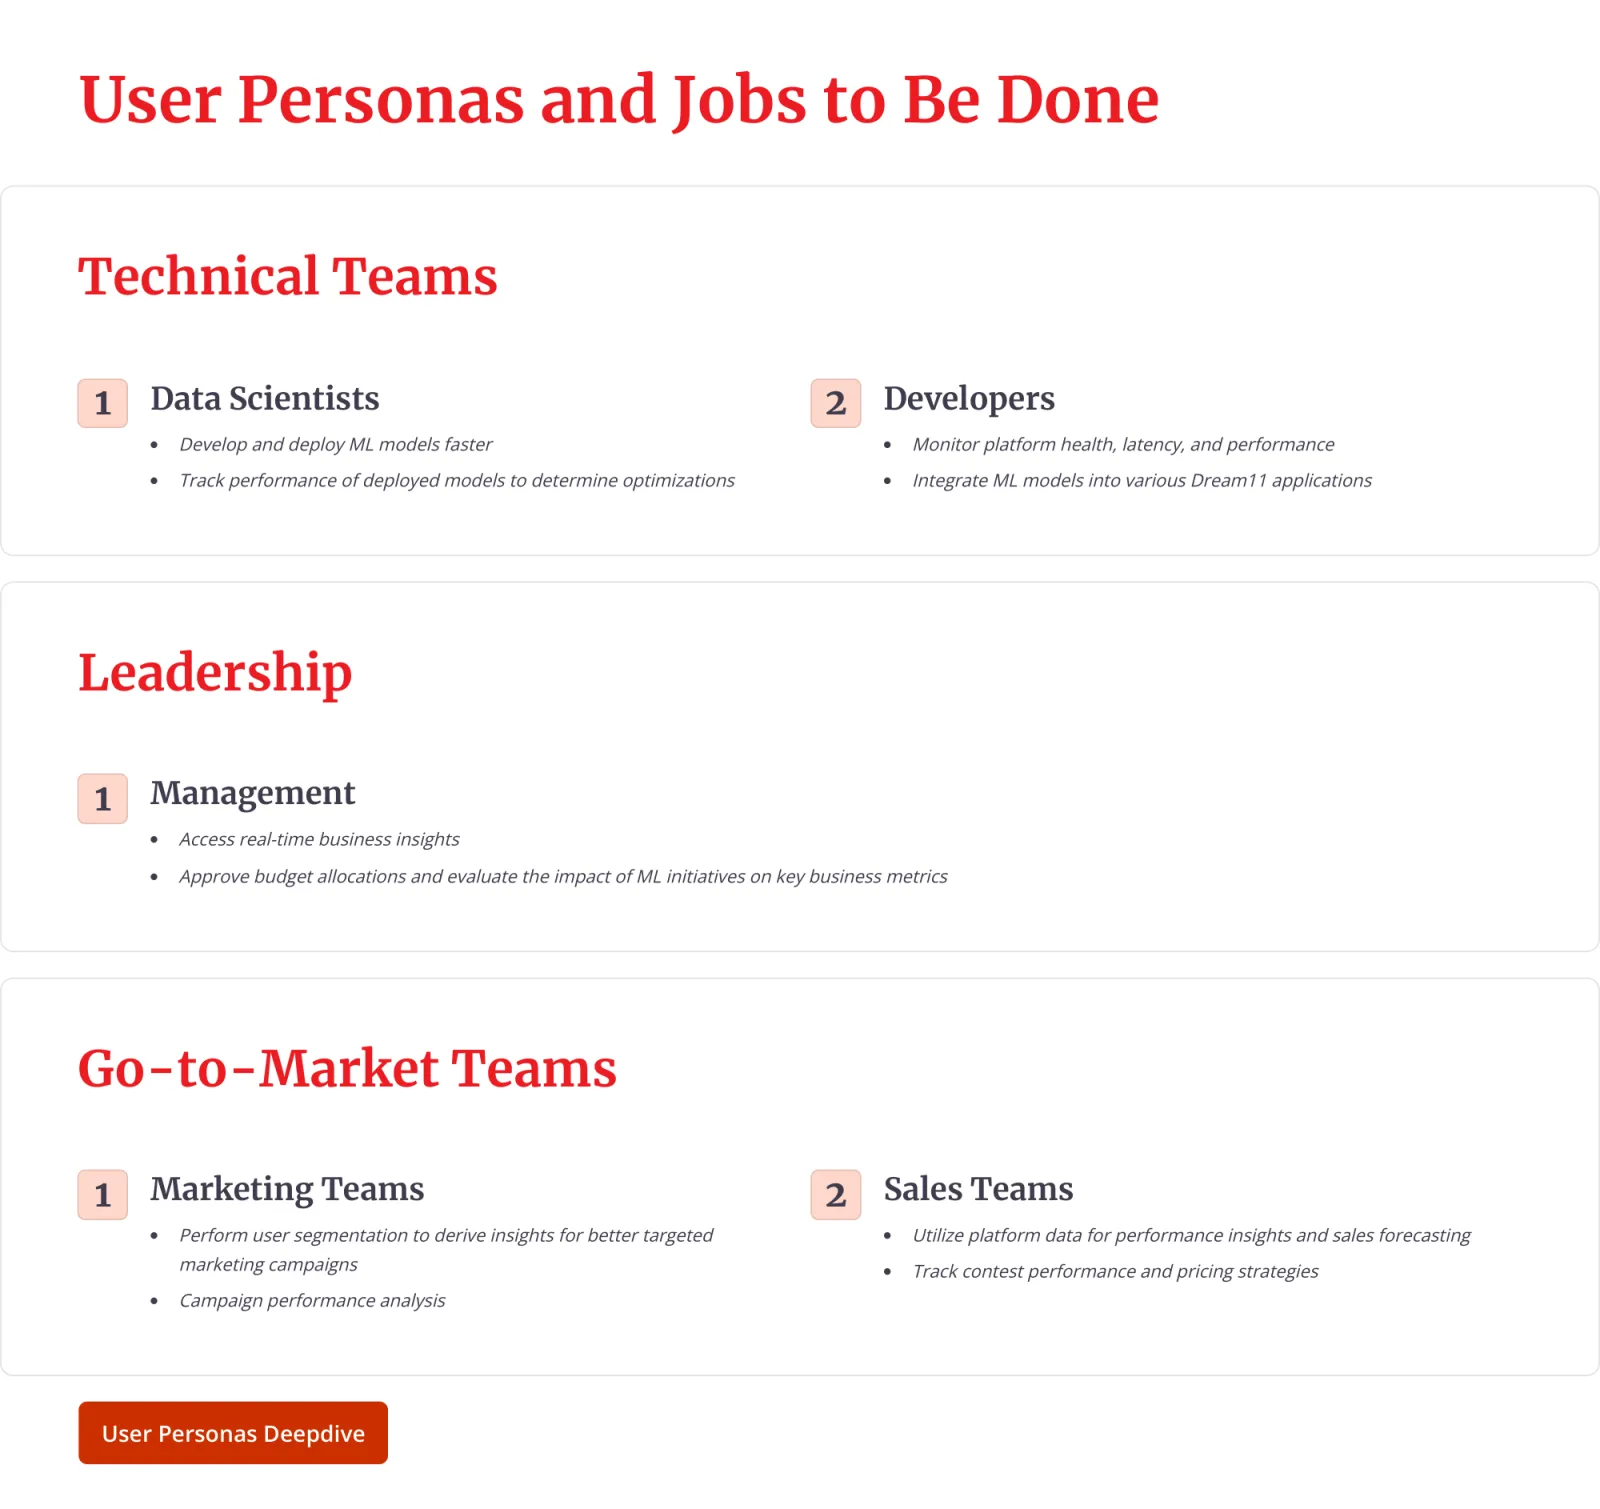
Slide 7, User Personas and Jobs to Be Done. Technical teams. Data scientists: develop and deploy ML models faster; track performance of deployed models to determine optimizations. Developers: monitor platform health, latency and performance; integrate ML models into various Dream11 applications. Leadership. Management: access real-time business insights; approve budget allocations and evaluate the impact of ML initiatives on key business metrics. Go-to-market teams. Marketing teams: perform user segmentation to derive insights for better targeted marketing campaigns; campaign performance analysis. Sales teams: utilize platform data for performance insights and sales forecasting; track contest performance and pricing strategies. A button links to the user personas deep dive.
Slide 7Open in deck (opens in a new tab)

Data Scientist

  • Accelerate model training to focus on high-impact problems instead of wasting time on infrastructure setup
  • Validate model accuracy to gain confidence in deploying new algorithms without manual error-checking
  • Collaborate with developers to deploy models faster without bottlenecks in handoffs

Developer

  • Automate deployment pipelines to ensure zero downtime during IPL matches instead of firefighting outages
  • Monitor system health to catch failures proactively without manual log scraping
  • Scale compute resources to handle 10M+ users without over-provisioning costs

Marketer

  • Identify high-value user segments to run targeted campaigns instead of generic ones
  • Measure the ROI of ML-driven features to justify budgets without guesswork
  • Simplify A/B testing to optimize creatives without relying on data scientists

Salesman

  • Track contest performance in real time to upsell sponsors without waiting for weekly reports
  • Simplify user behavior insights to pitch personalized contests without complex data analysis

Profiles

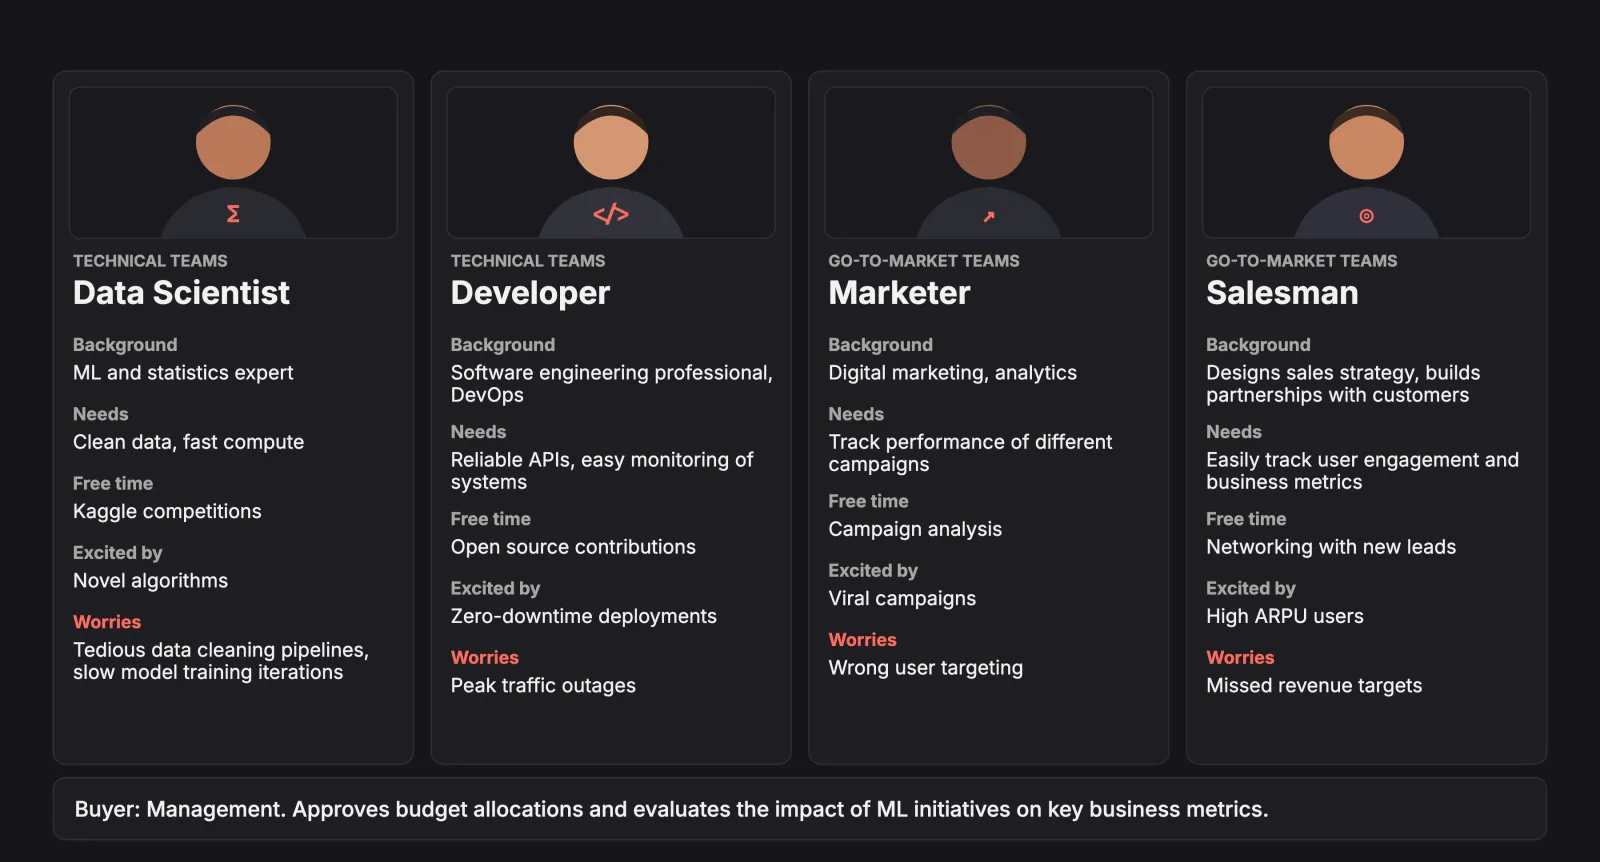
Four persona cards, each under a plain head-and-shoulders figure with no face. Data Scientist, technical teams. Background: ML and statistics expert. Needs: Clean data, fast compute. Free time: Kaggle competitions. Excited by: Novel algorithms. Worries: Tedious data cleaning pipelines, slow model training iterations. Developer, technical teams. Background: Software engineering professional, DevOps. Needs: Reliable APIs, easy monitoring of systems. Free time: Open source contributions. Excited by: Zero-downtime deployments. Worries: Peak traffic outages. Marketer, go-to-market teams. Background: Digital marketing, analytics. Needs: Track performance of different campaigns. Free time: Campaign analysis. Excited by: Viral campaigns. Worries: Wrong user targeting. Salesman, go-to-market teams. Background: Designs sales strategy, builds partnerships with customers. Needs: Easily track user engagement and business metrics. Free time: Networking with new leads. Excited by: High ARPU users. Worries: Missed revenue targets. A strip beneath reads: Buyer: Management. Approves budget allocations and evaluates the impact of ML initiatives on key business metrics.
Internal personasThe four profiles come from interviews with 10 individuals; the pain points in the brief's side explanation set the scope of the problems kept.

In-house

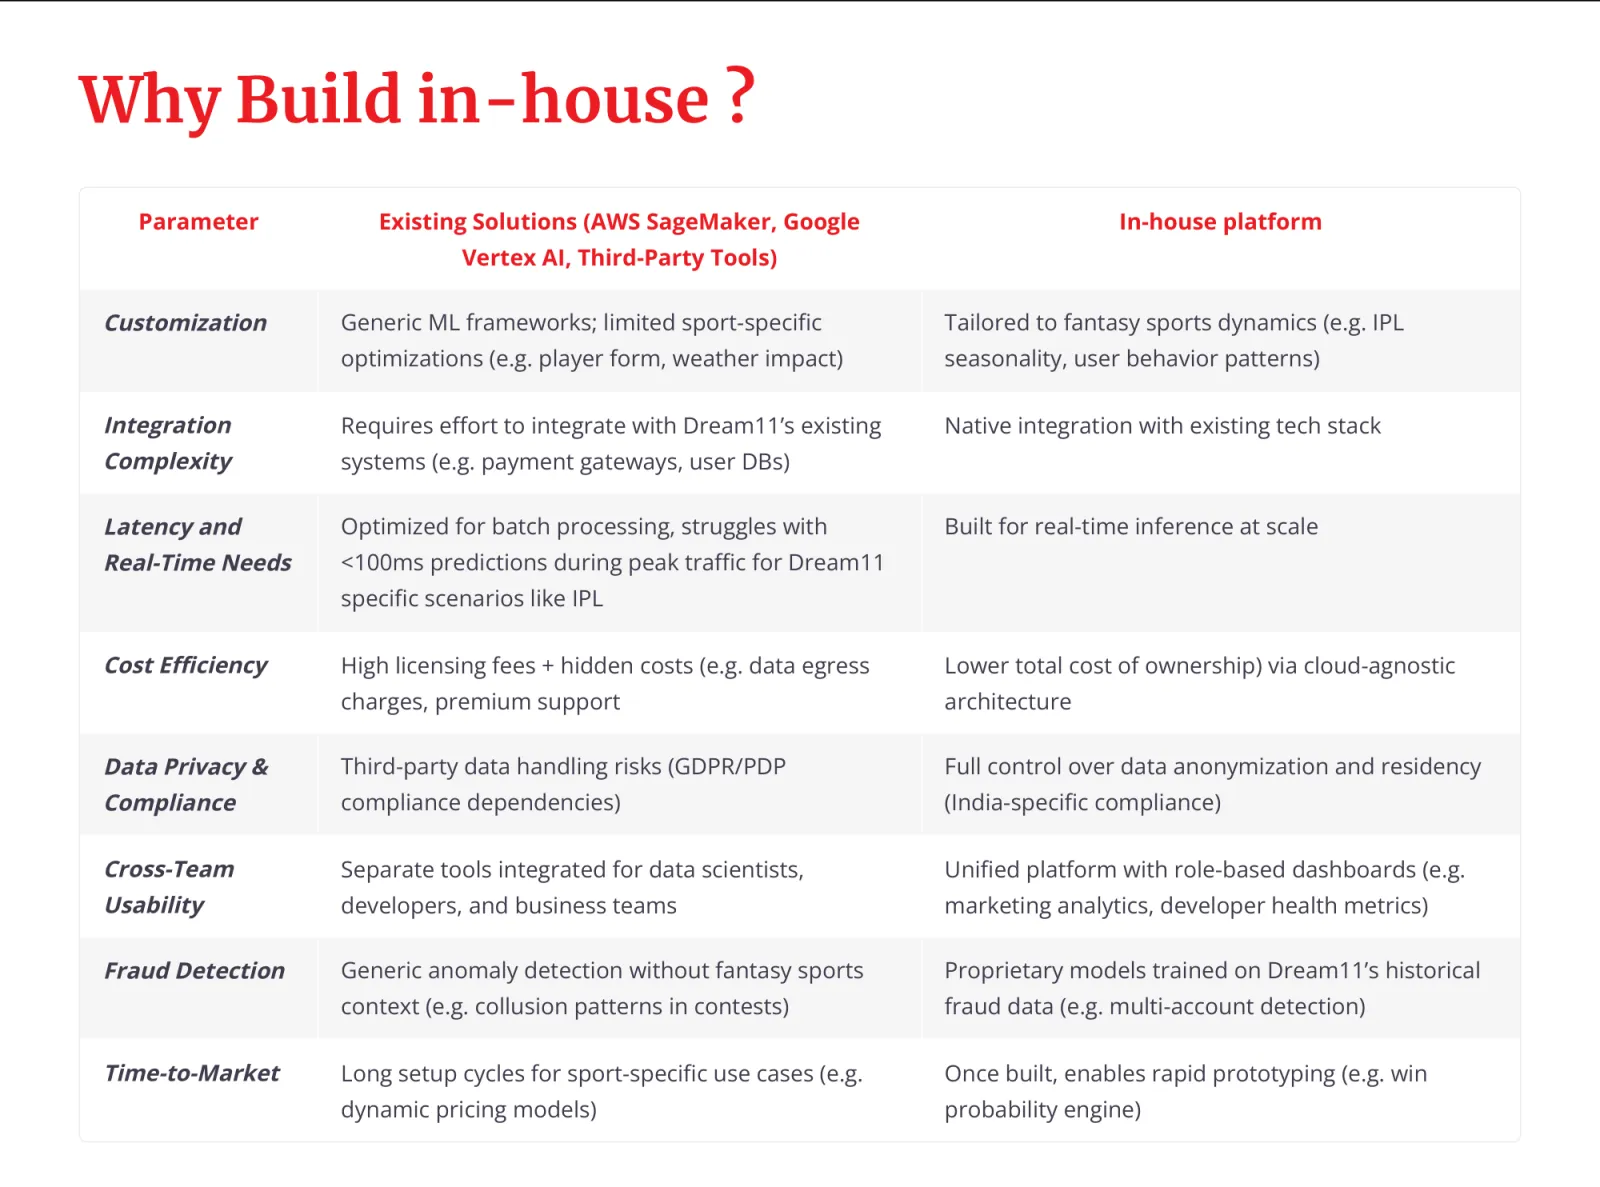
Slide 5, Why Build in-house? A table comparing existing solutions (AWS SageMaker, Google Vertex AI, third-party tools) with an in-house platform on eight parameters. Customization: generic ML frameworks with limited sport-specific optimizations such as player form and weather impact, against a platform tailored to fantasy sports dynamics such as IPL seasonality and user behavior patterns. Integration complexity: effort to integrate with Dream11's existing systems such as payment gateways and user databases, against native integration with the existing tech stack. Latency and real-time needs: optimized for batch processing, struggling with predictions under 100 milliseconds during peak traffic such as the IPL, against built for real-time inference at scale. Cost efficiency: high licensing fees plus hidden costs such as data egress charges and premium support, against a lower total cost of ownership via cloud-agnostic architecture. Data privacy and compliance: third-party data handling risks and GDPR or PDP compliance dependencies, against full control over data anonymization and residency for India-specific compliance. Cross-team usability: separate tools for data scientists, developers and business teams, against a unified platform with role-based dashboards such as marketing analytics and developer health metrics. Fraud detection: generic anomaly detection without fantasy sports context such as collusion patterns in contests, against proprietary models trained on Dream11's historical fraud data such as multi-account detection. Time to market: long setup cycles for sport-specific use cases such as dynamic pricing models, against rapid prototyping once built, such as a win probability engine.
Slide 5Open in deck (opens in a new tab)

Databricks

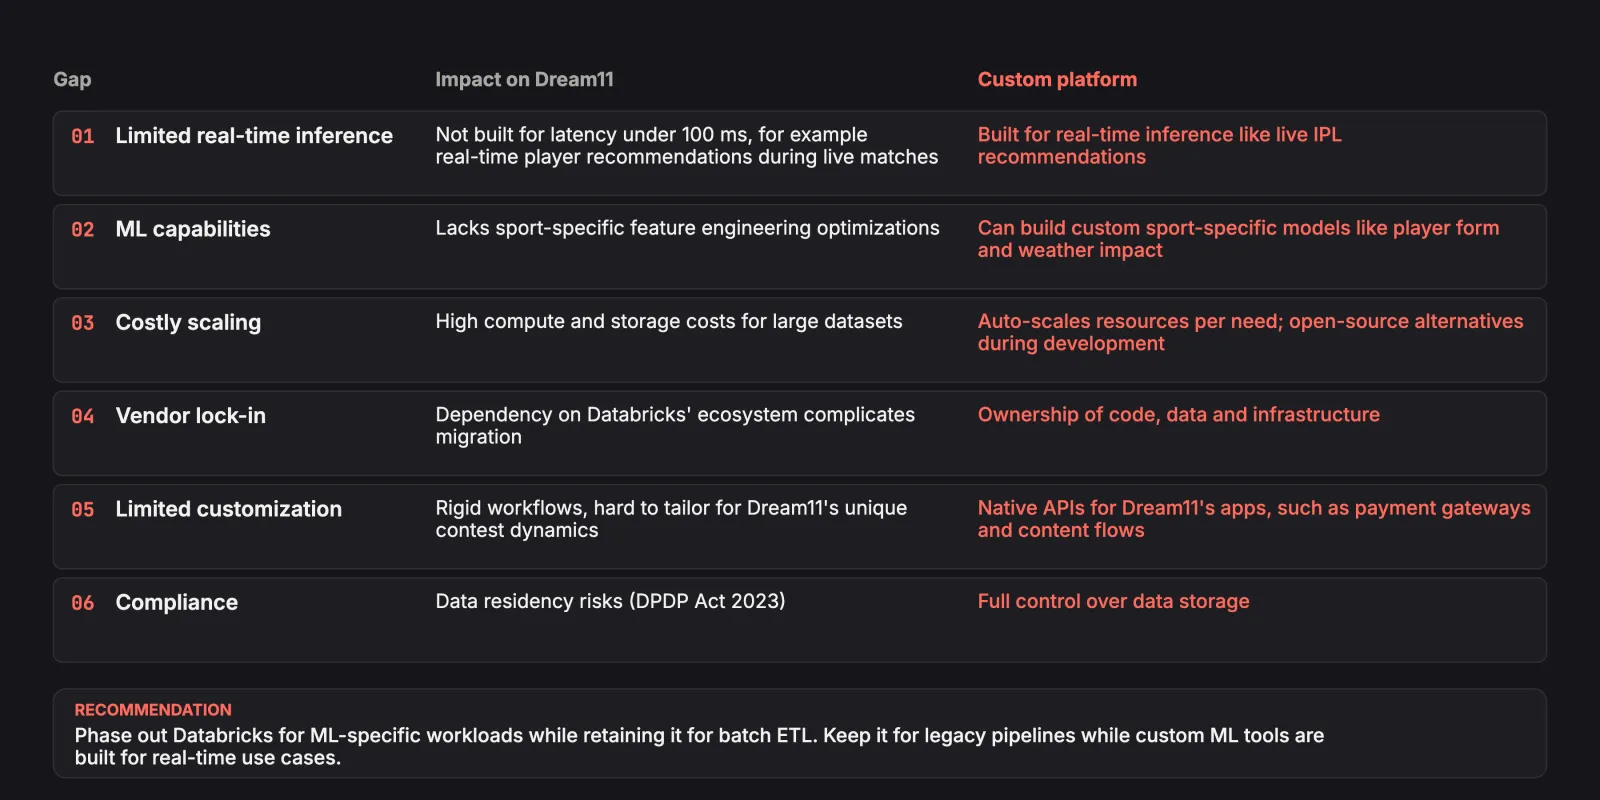
Six gaps in Databricks for this case, each with its impact on Dream11 and what a custom platform offers. 1, Limited real-time inference. Impact: Not built for latency under 100 ms, for example real-time player recommendations during live matches. Custom platform: Built for real-time inference like live IPL recommendations. 2, ML capabilities. Impact: Lacks sport-specific feature engineering optimizations. Custom platform: Can build custom sport-specific models like player form and weather impact. 3, Costly scaling. Impact: High compute and storage costs for large datasets. Custom platform: Auto-scales resources per need; open-source alternatives during development. 4, Vendor lock-in. Impact: Dependency on Databricks' ecosystem complicates migration. Custom platform: Ownership of code, data and infrastructure. 5, Limited customization. Impact: Rigid workflows, hard to tailor for Dream11's unique contest dynamics. Custom platform: Native APIs for Dream11's apps, such as payment gateways and content flows. 6, Compliance. Impact: Data residency risks (DPDP Act 2023). Custom platform: Full control over data storage. Recommendation: Phase out Databricks for ML-specific workloads while retaining it for batch ETL. Keep it for legacy pipelines while custom ML tools are built for real-time use cases.
Databricks gaps

What Databricks offers

  • Unified analytics: data engineering, ML and analytics on one platform
  • Delta Lake, MLflow integration and collaborative notebooks
  • AutoML and serverless, Spark-based compute

Where it is strong

  • Large-scale data processing
  • Low-code interfaces for non-technical users such as marketing analysts
  • Automated cluster management; works with AWS, Azure and tools like Tableau

Pricing constraints

  • Costs scale with data volume and compute usage
  • Extra charges for ACID transactions and versioning
  • Security, role-based access and AutoML need higher-tier plans; egress and premium support cost more

Cost

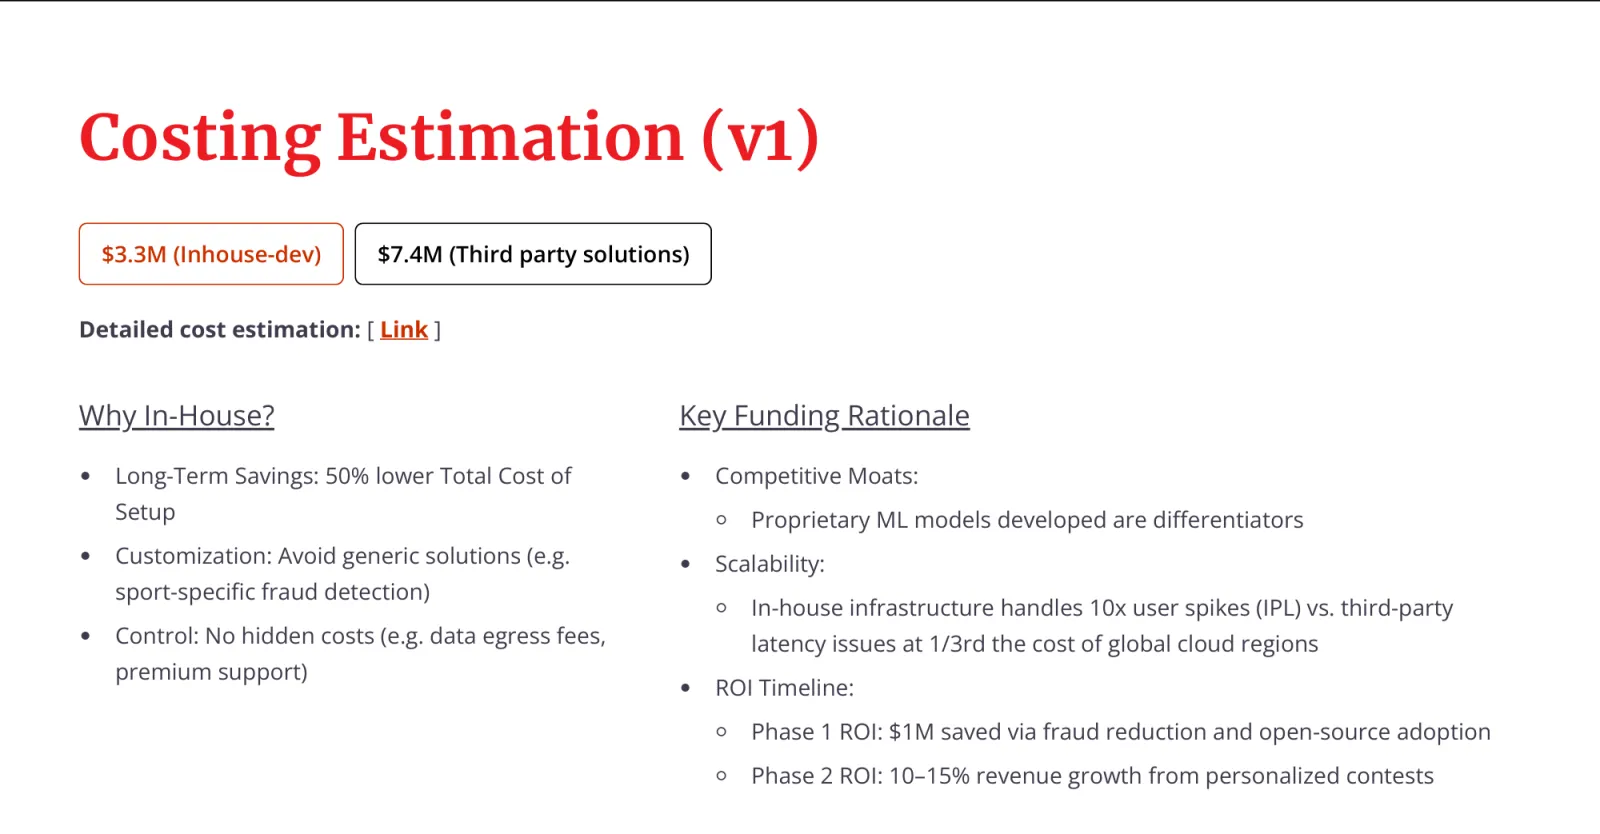
Slide 11, Costing Estimation (v1). $3.3M for in-house development against $7.4M for third-party solutions, with a link to the detailed cost estimation. Why in-house: long-term savings, 50% lower total cost of setup; customization, avoiding generic solutions such as sport-specific fraud detection; control, no hidden costs such as data egress fees and premium support. Key funding rationale. Competitive moats: proprietary ML models developed are differentiators. Scalability: in-house infrastructure handles 10 times user spikes during the IPL against third-party latency issues, at one third the cost of global cloud regions. ROI timeline: phase 1 ROI, $1M saved via fraud reduction and open-source adoption; phase 2 ROI, 10 to 15% revenue growth from personalized contests.
Slide 11A guesstimate, not Dream11's actual costs. The working behind the two totals is under Guesstimate.Open in deck (opens in a new tab)

Guesstimate

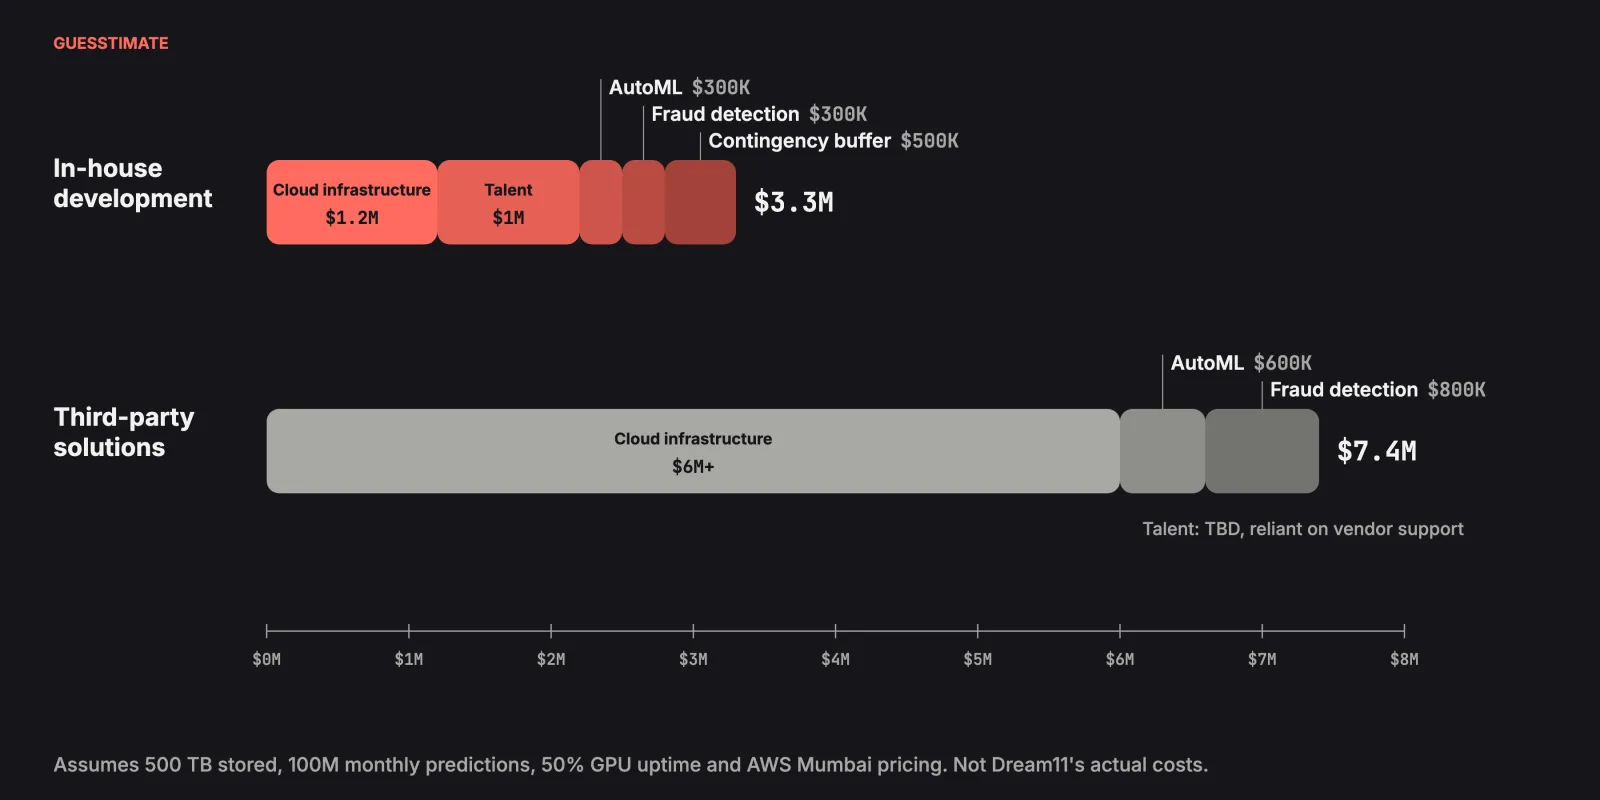
Two stacked bars on one axis from $0 to $8M, tagged Guesstimate. In-house development, $3.3M: cloud infrastructure $1.2M, talent $1M, AutoML $300K, fraud detection $300K, contingency buffer $500K. Third-party solutions, $7.4M: cloud infrastructure $6M+, AutoML $600K, fraud detection $800K, with the note Talent: TBD, reliant on vendor support. Footer: assumes 500 TB stored, 100M monthly predictions, 50% GPU uptime and AWS Mumbai pricing. Not Dream11's actual costs.
Phase 1 costThe appendix's phase 1 table, drawn to one scale. The three steps beneath recompute it.

Step 1

In-house cloud, per month

Compute, GPU and CPU$60K
Storage, S3 or a GCP bucket$20K
Networking$5K
Managed services$10K
Total$95K

$95K a month is $1.14M a year, which the appendix rounds to $1.2M.

Cloud, a year$1.2M

Step 2

Third-party cloud, per month

Databricks units$300K
Compute on SageMaker$100K
Storage on Delta Lake$50K
Data transfer and egress$30K
Support and licensing$20K
Total$500K

The appendix prices 100,000 units at $0.30 each as $300K; that product is $30K. Shown as written.

Cloud, a year$6M

Step 3

Phase 1 budget, in-house

Cloud infrastructure$1.2M
Talent: 8 ML engineers, 4 data scientists, 2 architects$1M
AutoML on open-source tools$300K
Fraud detection, custom-built$300K
Contingency buffer$500K
Total$3.3M

Third party: $6M cloud, $600K AutoML and $800K fraud detection, $7.4M in all, with talent left as TBD.

Against third party$3.3M vs $7.4M
Capabilities

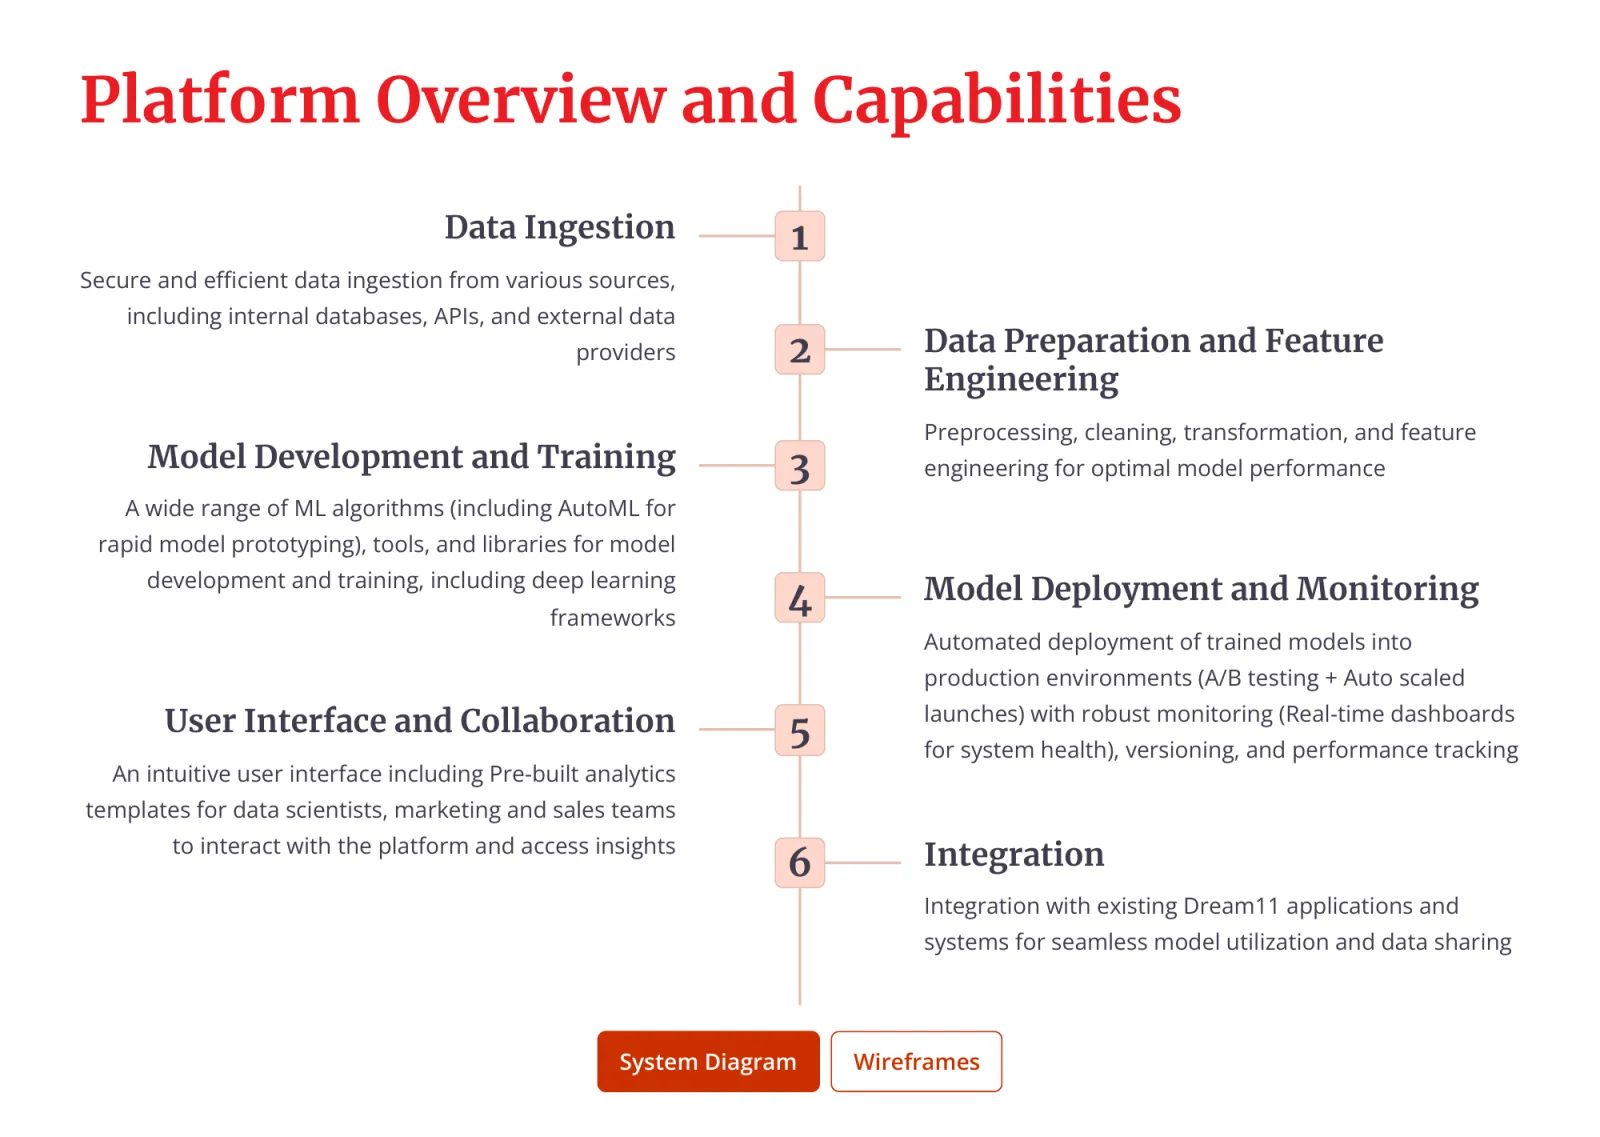
Slide 8, Platform Overview and Capabilities, six numbered capabilities. 1, Data ingestion: secure and efficient data ingestion from various sources, including internal databases, APIs and external data providers. 2, Data preparation and feature engineering: preprocessing, cleaning, transformation and feature engineering for optimal model performance. 3, Model development and training: a wide range of ML algorithms, including AutoML for rapid model prototyping, tools and libraries for model development and training, including deep learning frameworks. 4, Model deployment and monitoring: automated deployment of trained models into production environments with A/B testing and auto-scaled launches, with robust monitoring through real-time dashboards for system health, versioning and performance tracking. 5, User interface and collaboration: an intuitive user interface including pre-built analytics templates for data scientists, marketing and sales teams to interact with the platform and access insights. 6, Integration: integration with existing Dream11 applications and systems for seamless model utilization and data sharing. Buttons link to the system diagram and the wireframes.
Slide 8Open in deck (opens in a new tab)

Architecture

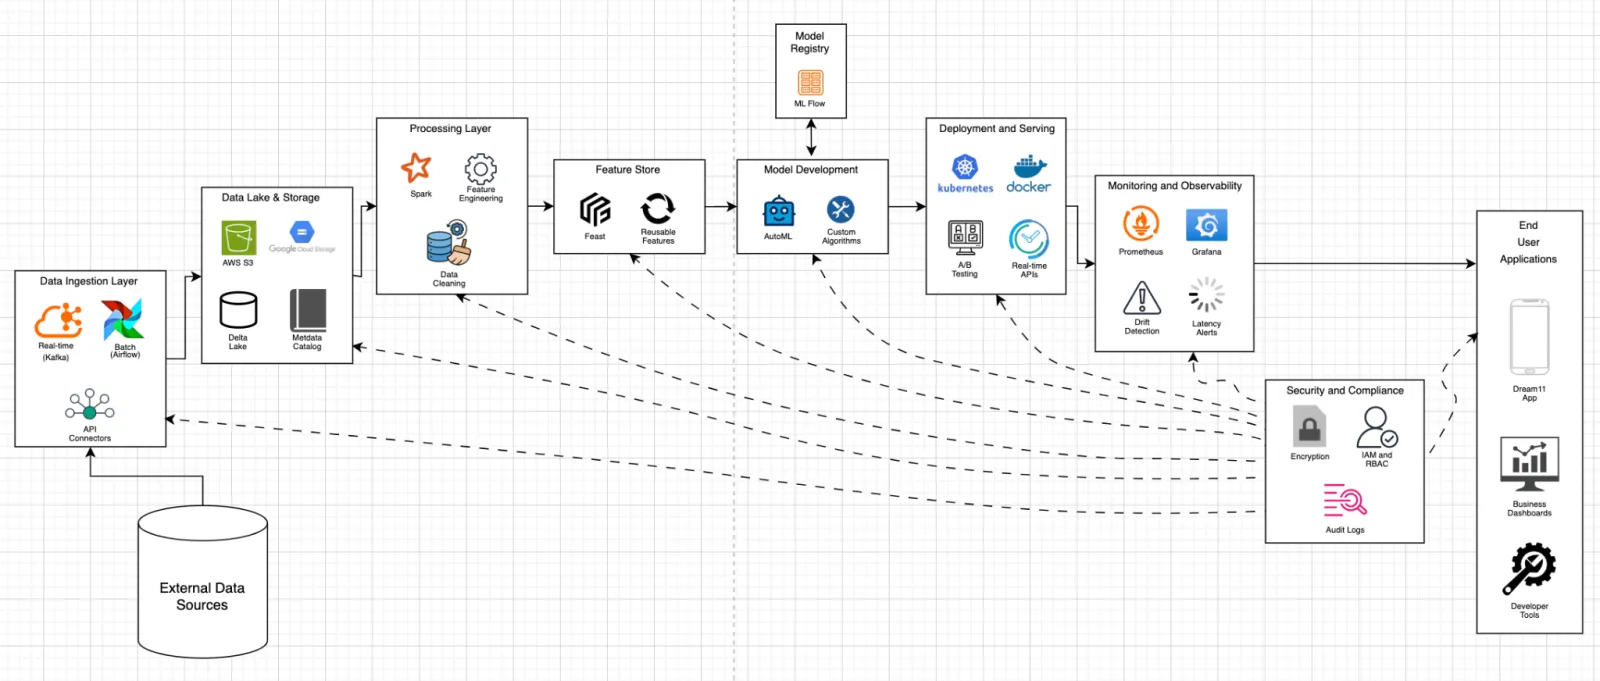
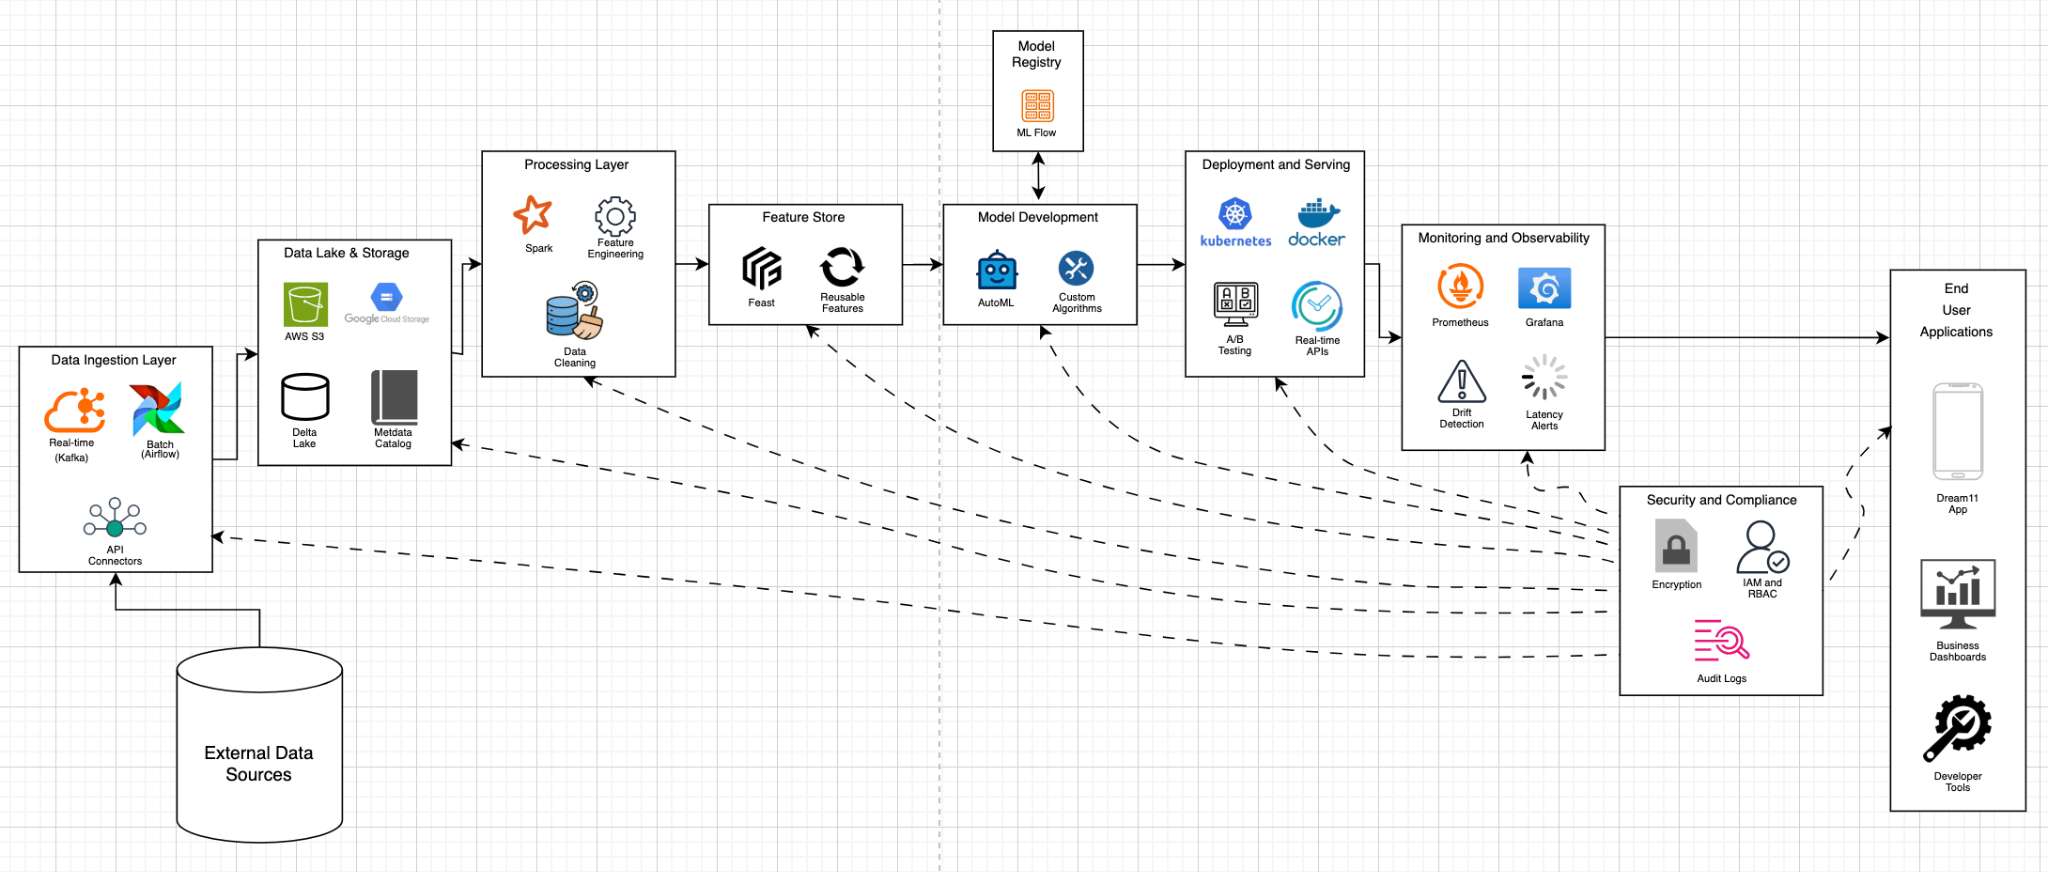
System architecture diagram, left to right. External data sources feed the data ingestion layer: real-time with Kafka, batch with Airflow, and API connectors. That feeds the data lake and storage: AWS S3, Google Cloud Storage, Delta Lake and a metadata catalog. Then the processing layer: Spark, feature engineering and data cleaning. Then the feature store: Feast and reusable features. Then model development: AutoML and custom algorithms, joined both ways to a model registry on MLflow. Then deployment and serving: Kubernetes, Docker, A/B testing and real-time APIs. Then monitoring and observability: Prometheus, Grafana, drift detection and latency alerts. That leads to the end user applications: the Dream11 app, business dashboards and developer tools. A security and compliance block, with encryption, IAM and RBAC, and audit logs, connects by dashed lines to every layer and to the end user applications.
System architectureThe system diagram from the appendix. A design proposed in the case, not Dream11's own architecture.

01

Data ingestion

Real-time with Kafka, batch with Airflow, and API connectors to external data sources.

02

Data lake and storage

AWS S3, Google Cloud Storage, Delta Lake and a metadata catalog.

03

Processing

Spark, feature engineering and data cleaning.

04

Feature store

Feast, holding reusable features.

05

Model development

AutoML and custom algorithms, with a model registry on MLflow.

06

Deployment and serving

Kubernetes, Docker, A/B testing and real-time APIs.

07

Monitoring and observability

Prometheus, Grafana, drift detection and latency alerts.

08

Security and compliance

Encryption, IAM and RBAC, and audit logs, connected to every layer.
Criteria

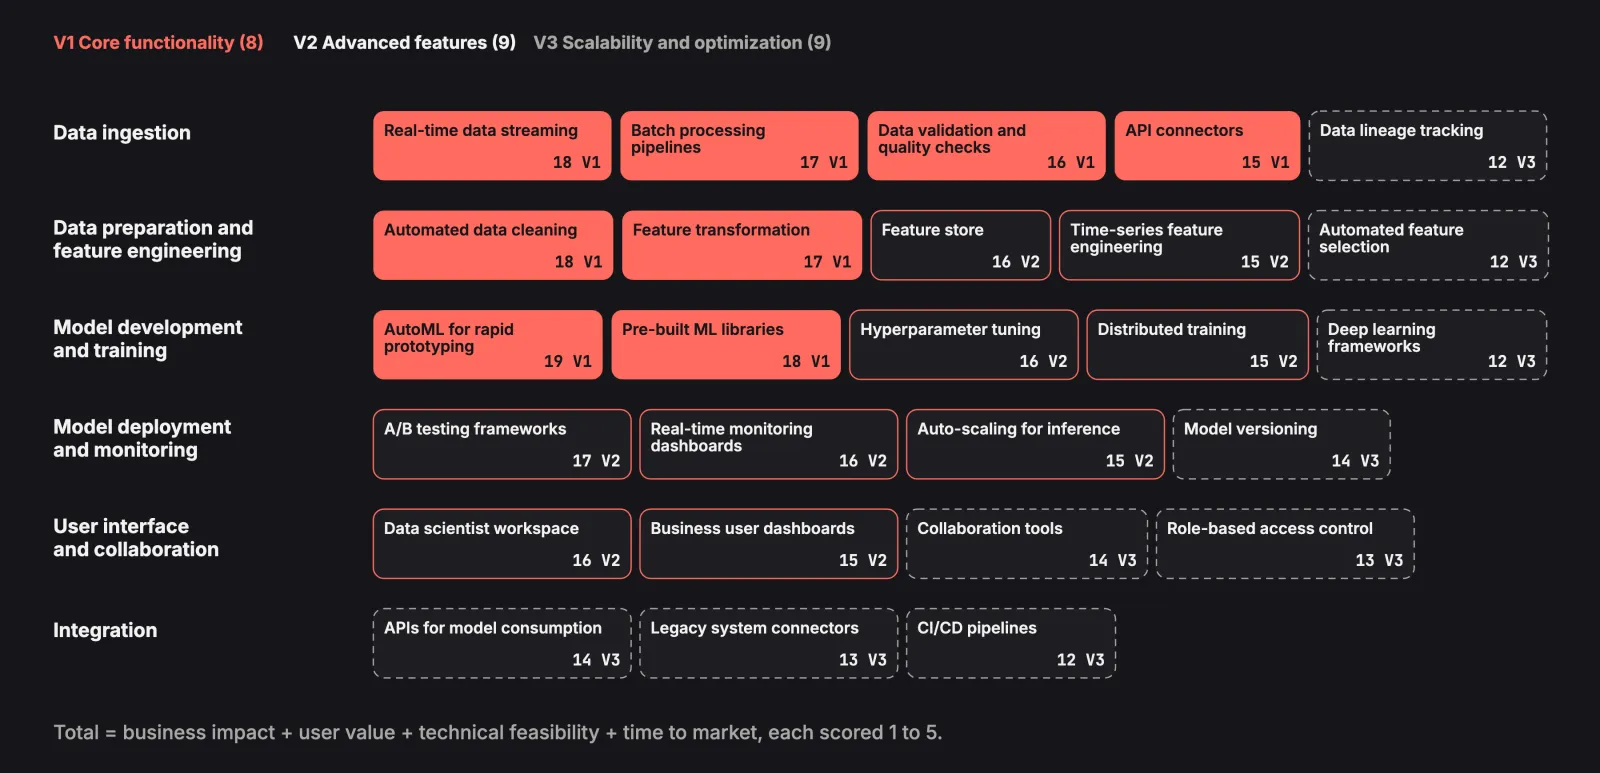
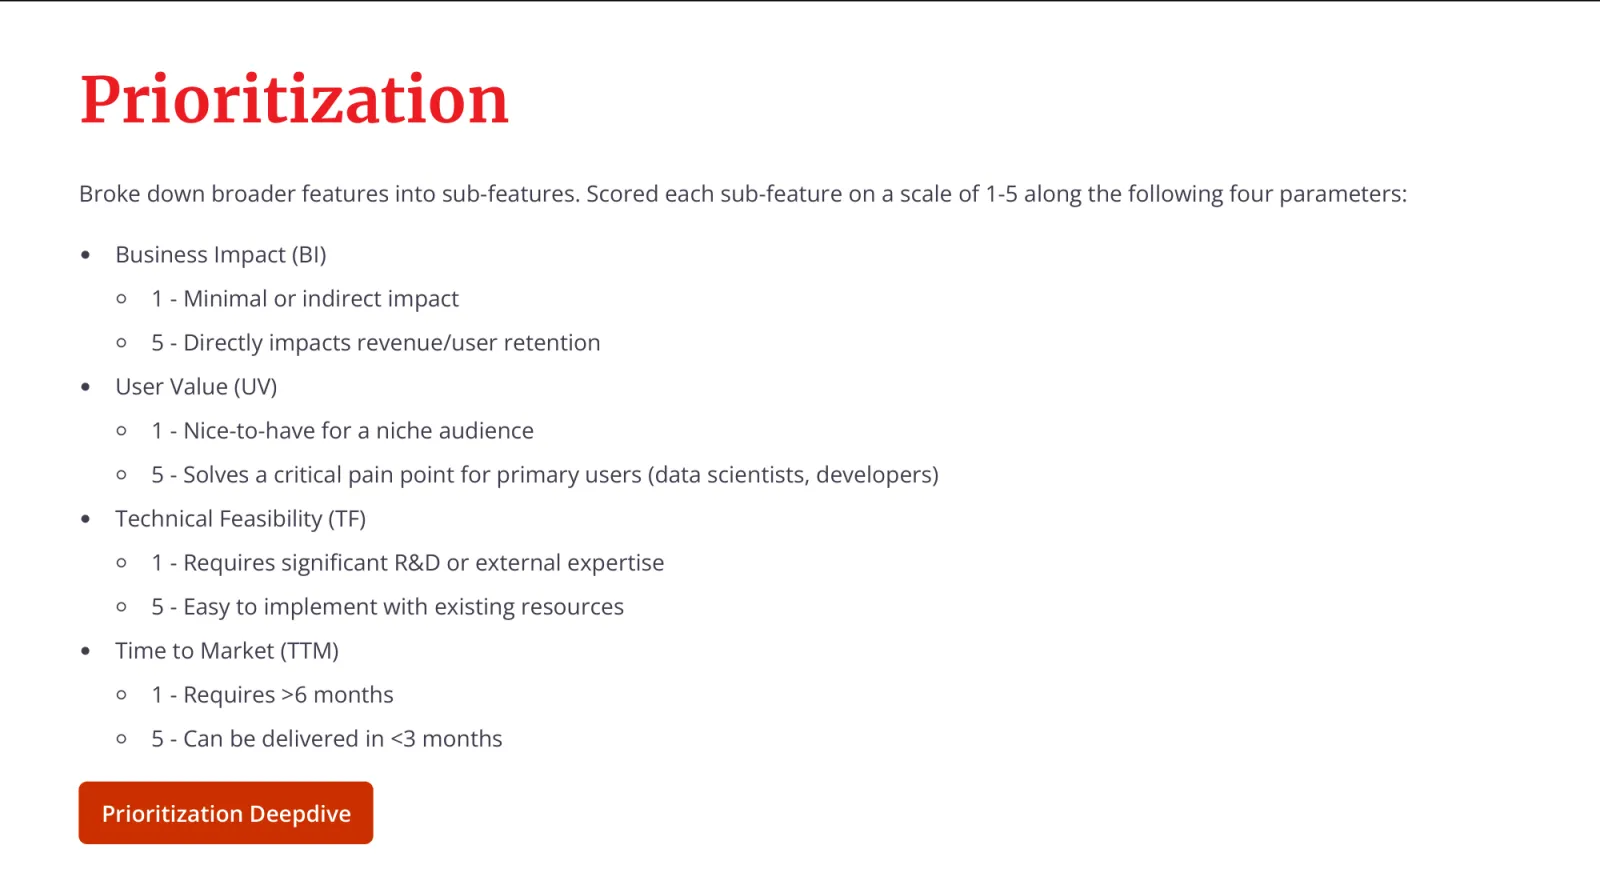
Slide 9, Prioritization. Broke down broader features into sub-features and scored each sub-feature on a scale of 1 to 5 along four parameters. Business impact: 1 is minimal or indirect impact, 5 directly impacts revenue or user retention. User value: 1 is nice to have for a niche audience, 5 solves a critical pain point for primary users, data scientists and developers. Technical feasibility: 1 requires significant R&D or external expertise, 5 is easy to implement with existing resources. Time to market: 1 requires more than 6 months, 5 can be delivered in under 3 months. A button links to the prioritization deep dive.
Slide 9Open in deck (opens in a new tab)

Scores

The 26 sub-features as chips in six rows, one row per capability area, each chip with its total out of 20 and its release. V1, core functionality, 8 chips, filled red. V2, advanced features, 9 chips, outlined in red. V3, scalability and optimization, 9 chips, dashed grey outline. Data ingestion: Real-time data streaming 18 V1, Batch processing pipelines 17 V1, Data validation and quality checks 16 V1, API connectors 15 V1, Data lineage tracking 12 V3. Data preparation and feature engineering: Automated data cleaning 18 V1, Feature transformation 17 V1, Feature store 16 V2, Time-series feature engineering 15 V2, Automated feature selection 12 V3. Model development and training: AutoML for rapid prototyping 19 V1, Pre-built ML libraries 18 V1, Hyperparameter tuning 16 V2, Distributed training 15 V2, Deep learning frameworks 12 V3. Model deployment and monitoring: A/B testing frameworks 17 V2, Real-time monitoring dashboards 16 V2, Auto-scaling for inference 15 V2, Model versioning 14 V3. User interface and collaboration: Data scientist workspace 16 V2, Business user dashboards 15 V2, Collaboration tools 14 V3, Role-based access control 13 V3. Integration: APIs for model consumption 14 V3, Legacy system connectors 13 V3, CI/CD pipelines 12 V3. Total is business impact plus user value plus technical feasibility plus time to market, each scored 1 to 5.
Prioritization map

By parameter

Data ingestionBIUVTFTTMTotalIn
Real-time data streaming554418V1
Batch processing pipelines544417V1
Data validation and quality checks454316V1
API connectors443415V1
Data lineage tracking332412V3
Data preparation and feature engineeringBIUVTFTTMTotalIn
Automated data cleaning554418V1
Feature transformation544417V1
Feature store453416V2
Time-series feature engineering443415V2
Automated feature selection333312V3
Model development and trainingBIUVTFTTMTotalIn
AutoML for rapid prototyping554519V1
Pre-built ML libraries554418V1
Hyperparameter tuning443516V2
Distributed training442515V2
Deep learning frameworks332412V3
Model deployment and monitoringBIUVTFTTMTotalIn
A/B testing frameworks544417V2
Real-time monitoring dashboards453416V2
Auto-scaling for inference443415V2
Model versioning333514V3
User interface and collaborationBIUVTFTTMTotalIn
Data scientist workspace454316V2
Business user dashboards444315V2
Collaboration tools343414V3
Role-based access control333413V3
IntegrationBIUVTFTTMTotalIn
APIs for model consumption443314V3
Legacy system connectors332513V3
CI/CD pipelines333312V3

From the appendix, each parameter out of 5: BI business impact, UV user value, TF technical feasibility, TTM time to market. The release is the one slide 10 gives; the appendix holds the reason for each score.
Releases

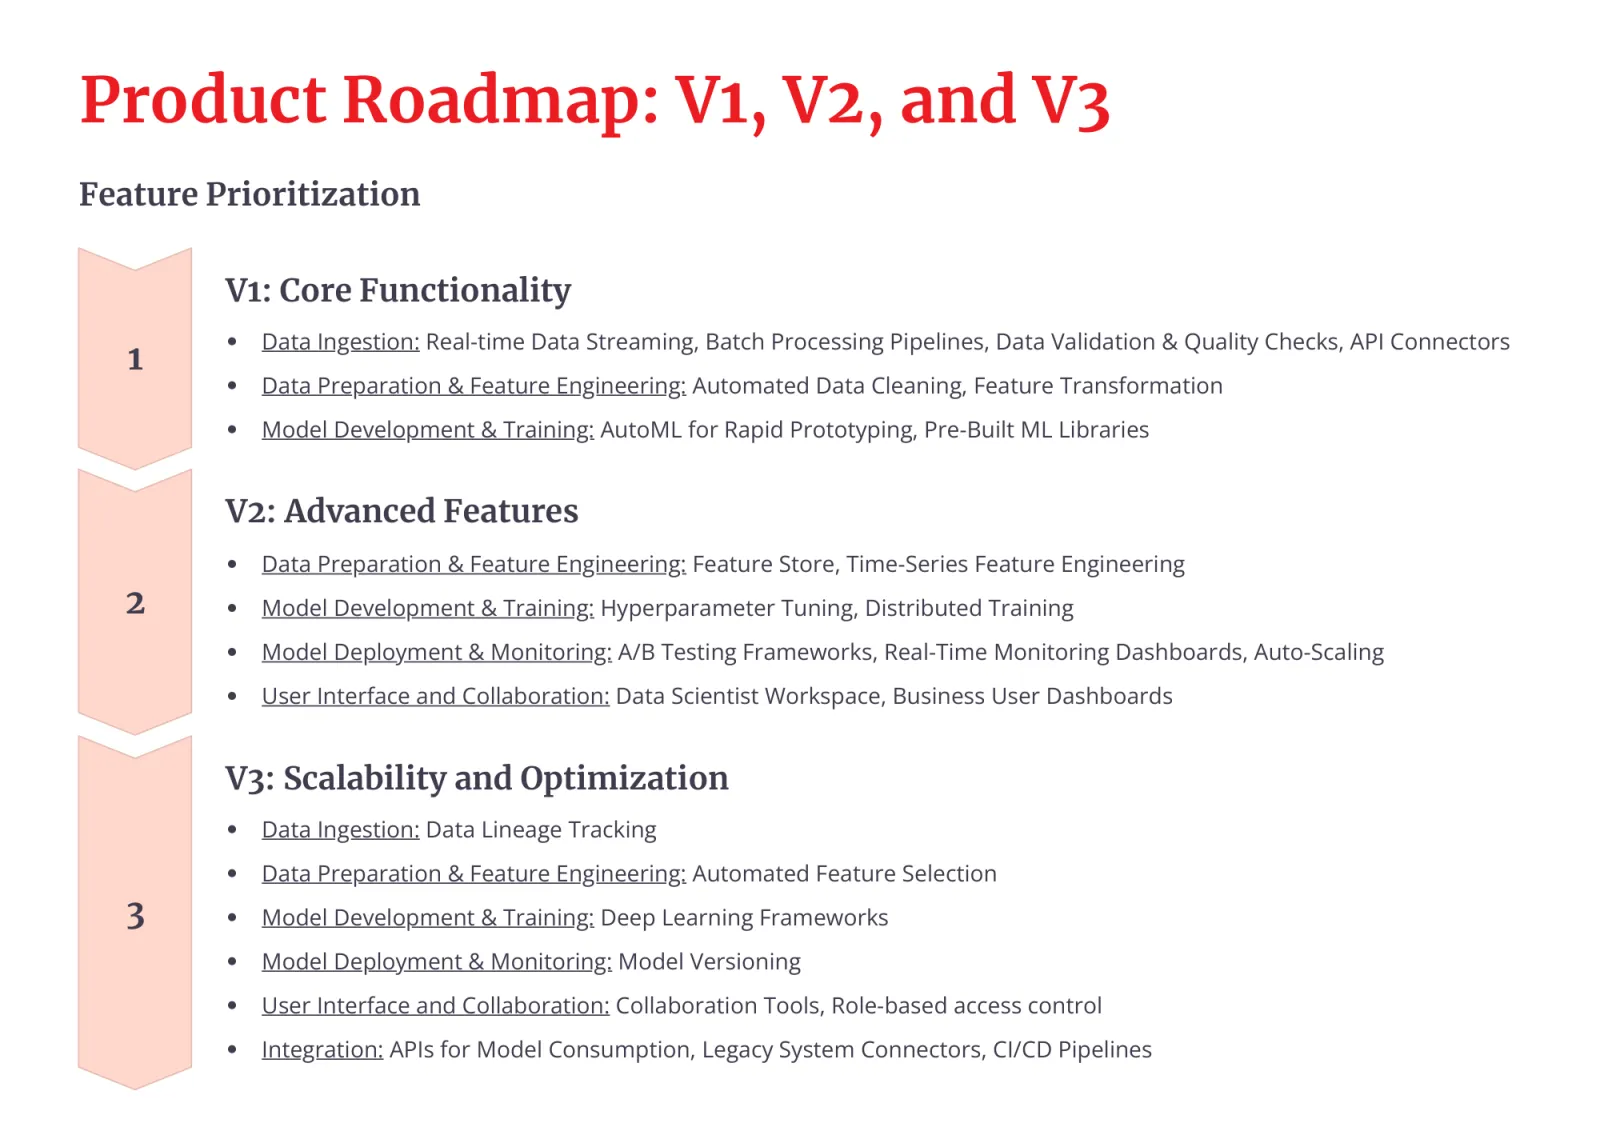
Slide 10, Product Roadmap: V1, V2 and V3, feature prioritization. V1, core functionality. Data ingestion: real-time data streaming, batch processing pipelines, data validation and quality checks, API connectors. Data preparation and feature engineering: automated data cleaning, feature transformation. Model development and training: AutoML for rapid prototyping, pre-built ML libraries. V2, advanced features. Data preparation and feature engineering: feature store, time-series feature engineering. Model development and training: hyperparameter tuning, distributed training. Model deployment and monitoring: A/B testing frameworks, real-time monitoring dashboards, auto-scaling. User interface and collaboration: data scientist workspace, business user dashboards. V3, scalability and optimization. Data ingestion: data lineage tracking. Data preparation and feature engineering: automated feature selection. Model development and training: deep learning frameworks. Model deployment and monitoring: model versioning. User interface and collaboration: collaboration tools, role-based access control. Integration: APIs for model consumption, legacy system connectors, CI/CD pipelines.
Slide 10Open in deck (opens in a new tab)

Build path

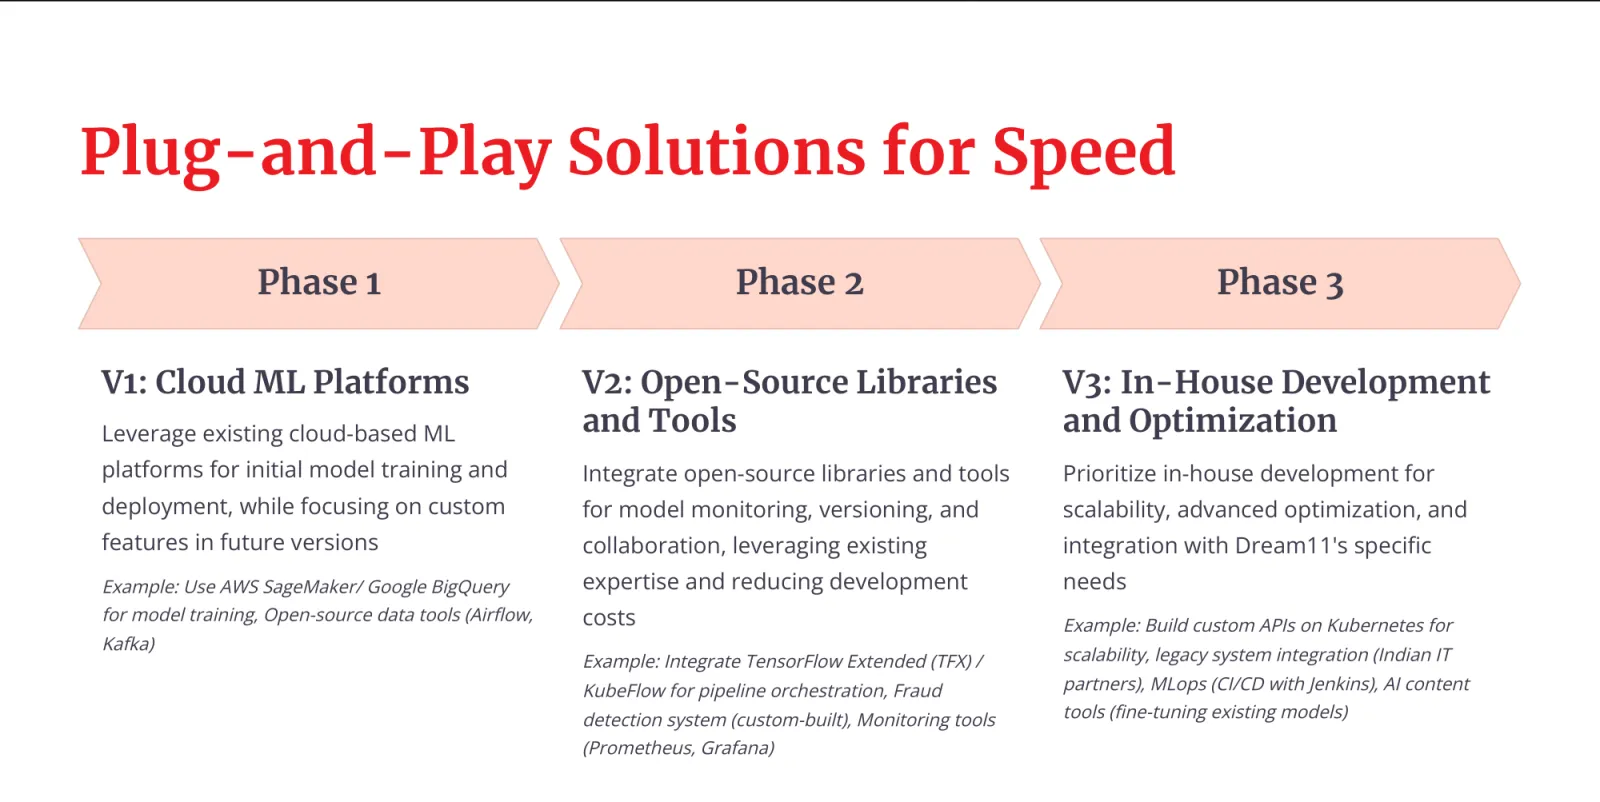
Slide 12, Plug-and-Play Solutions for Speed, three phases. Phase 1, V1, cloud ML platforms: leverage existing cloud-based ML platforms for initial model training and deployment, while focusing on custom features in future versions; example, use AWS SageMaker or Google BigQuery for model training and open-source data tools, Airflow and Kafka. Phase 2, V2, open-source libraries and tools: integrate open-source libraries and tools for model monitoring, versioning and collaboration, leveraging existing expertise and reducing development costs; example, TensorFlow Extended or KubeFlow for pipeline orchestration, a custom-built fraud detection system, and Prometheus and Grafana for monitoring. Phase 3, V3, in-house development and optimization: prioritize in-house development for scalability, advanced optimization and integration with Dream11's specific needs; example, custom APIs on Kubernetes for scalability, legacy system integration with Indian IT partners, MLOps with CI/CD on Jenkins, and AI content tools by fine-tuning existing models.
Slide 12Open in deck (opens in a new tab)

v1 metrics

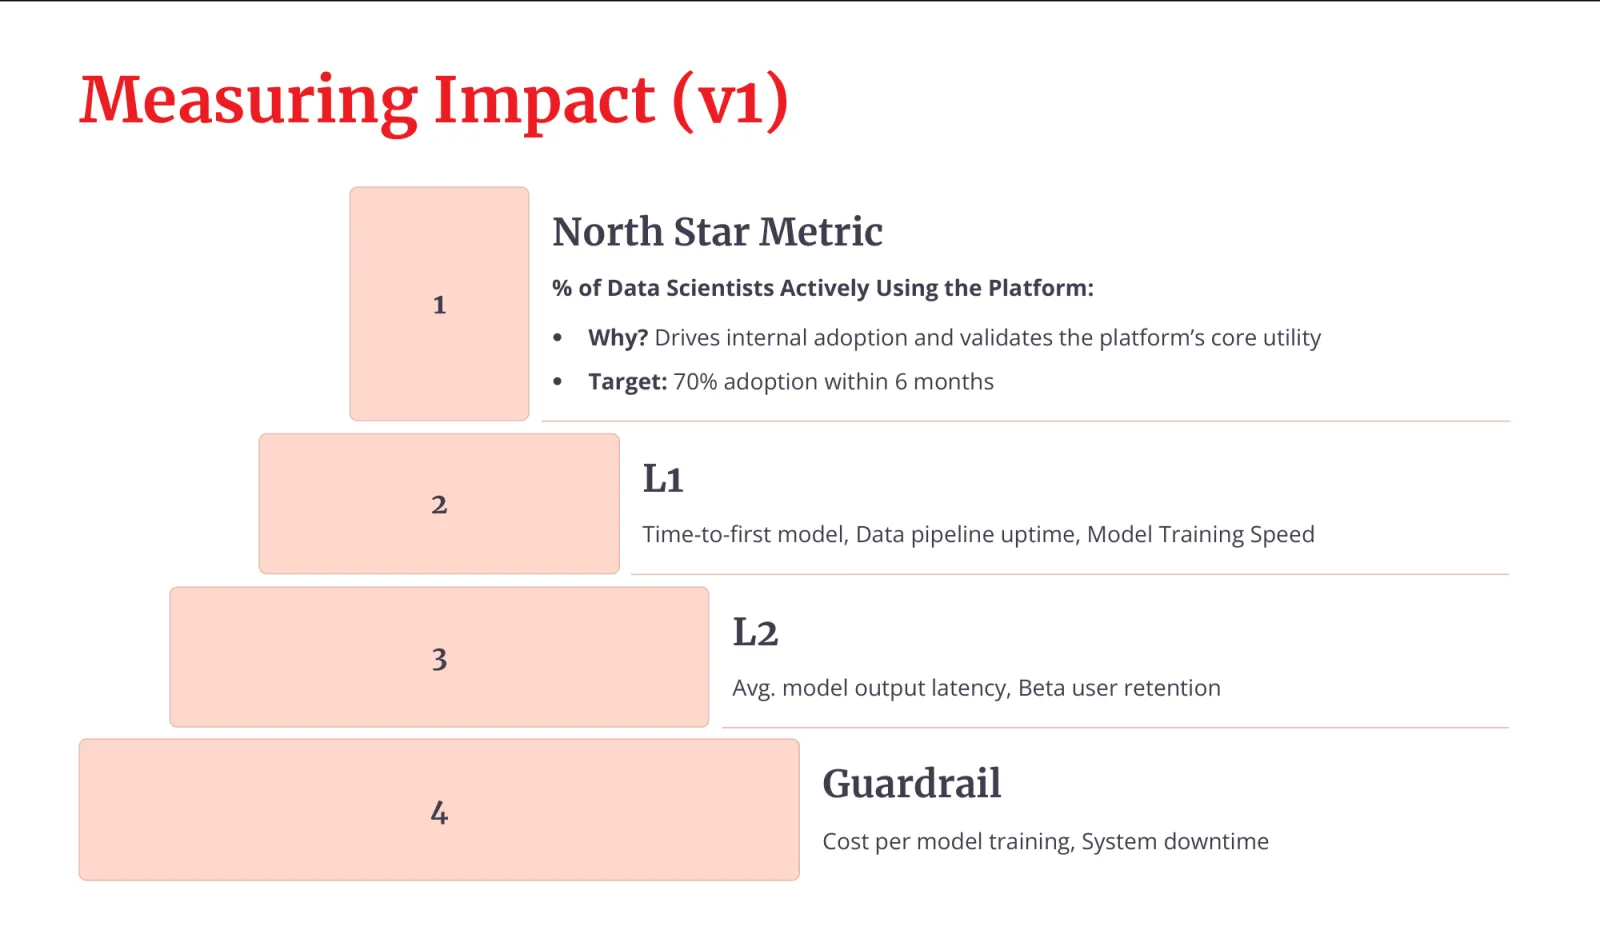
Slide 14, Measuring Impact (v1), a four-tier pyramid. 1, North star metric: percentage of data scientists actively using the platform; why, it drives internal adoption and validates the platform's core utility; target, 70% adoption within 6 months. 2, L1: time to first model, data pipeline uptime, model training speed. 3, L2: average model output latency, beta user retention. 4, Guardrail: cost per model training, system downtime.
Slide 14A proposed measurement framework for v1. Nothing here was measured.Open in deck (opens in a new tab)

Expected impact

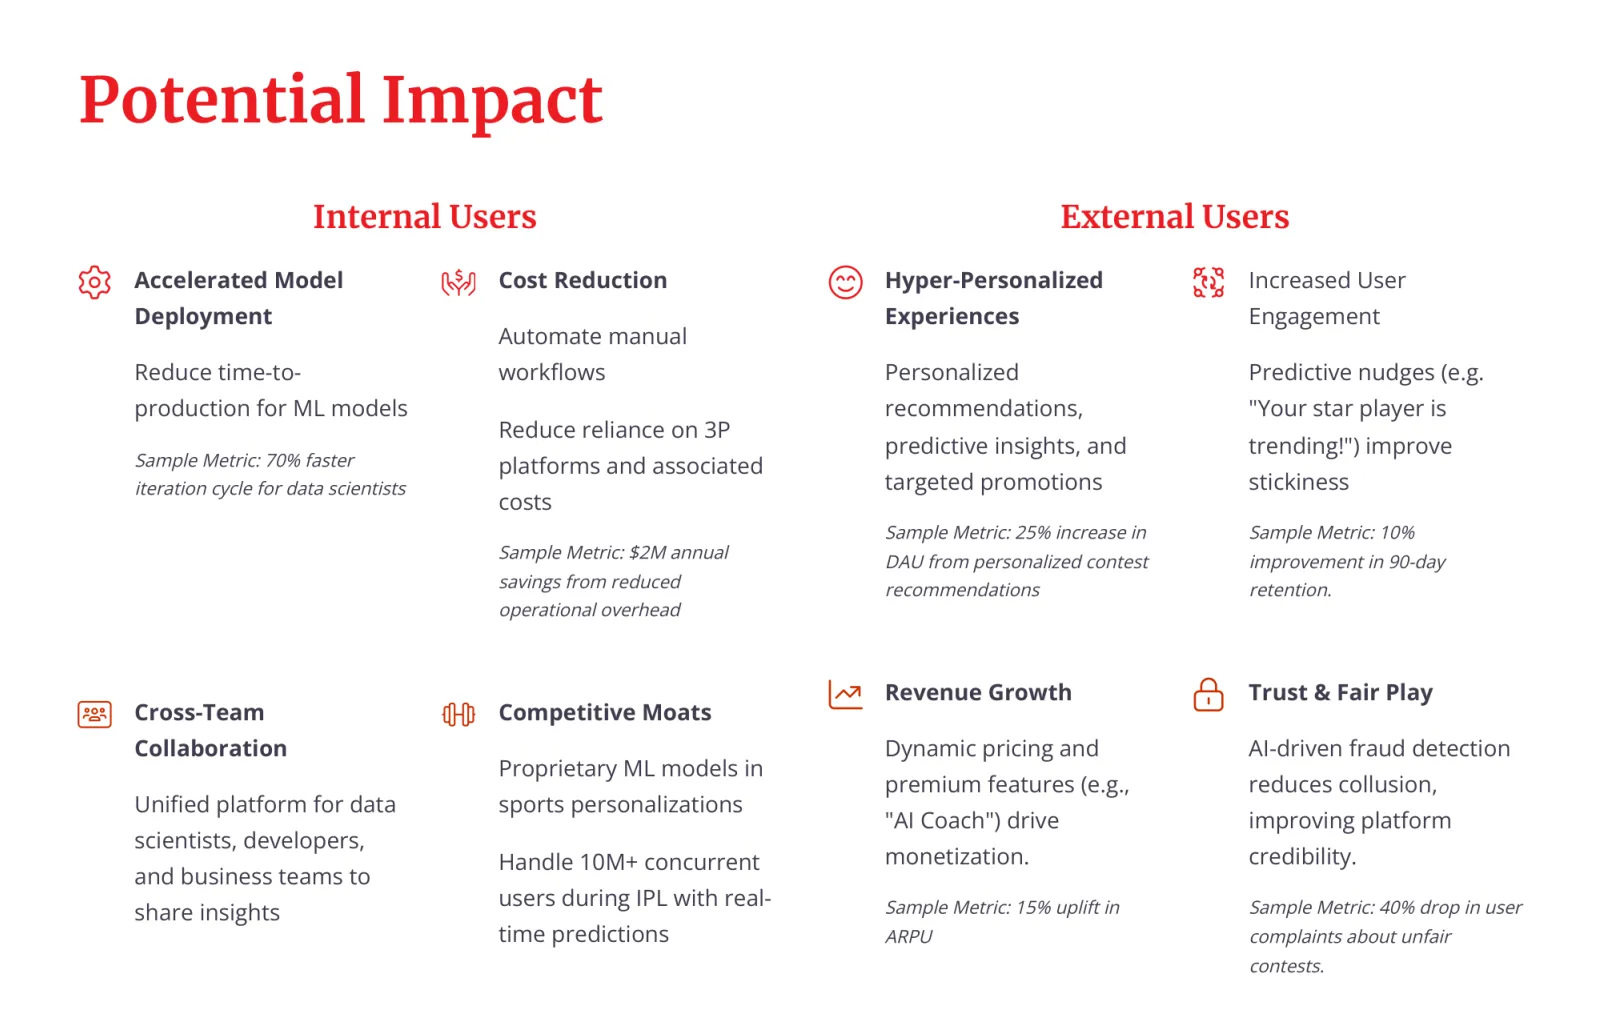
Slide 3, Potential Impact. Internal users. Accelerated model deployment: reduce time to production for ML models; sample metric, 70% faster iteration cycle for data scientists. Cost reduction: automate manual workflows and reduce reliance on third-party platforms and associated costs; sample metric, $2M annual savings from reduced operational overhead. Cross-team collaboration: a unified platform for data scientists, developers and business teams to share insights. Competitive moats: proprietary ML models in sports personalization; handle 10M plus concurrent users during the IPL with real-time predictions. External users. Hyper-personalized experiences: personalized recommendations, predictive insights and targeted promotions; sample metric, 25% increase in DAU from personalized contest recommendations. Increased user engagement: predictive nudges such as your star player is trending improve stickiness; sample metric, 10% improvement in 90-day retention. Revenue growth: dynamic pricing and premium features such as an AI Coach drive monetization; sample metric, 15% uplift in ARPU. Trust and fair play: AI-driven fraud detection reduces collusion, improving platform credibility; sample metric, 40% drop in user complaints about unfair contests.
Slide 3The slide labels each figure a sample metric: a target the pitch argues for, not a result.Open in deck (opens in a new tab)

Risks

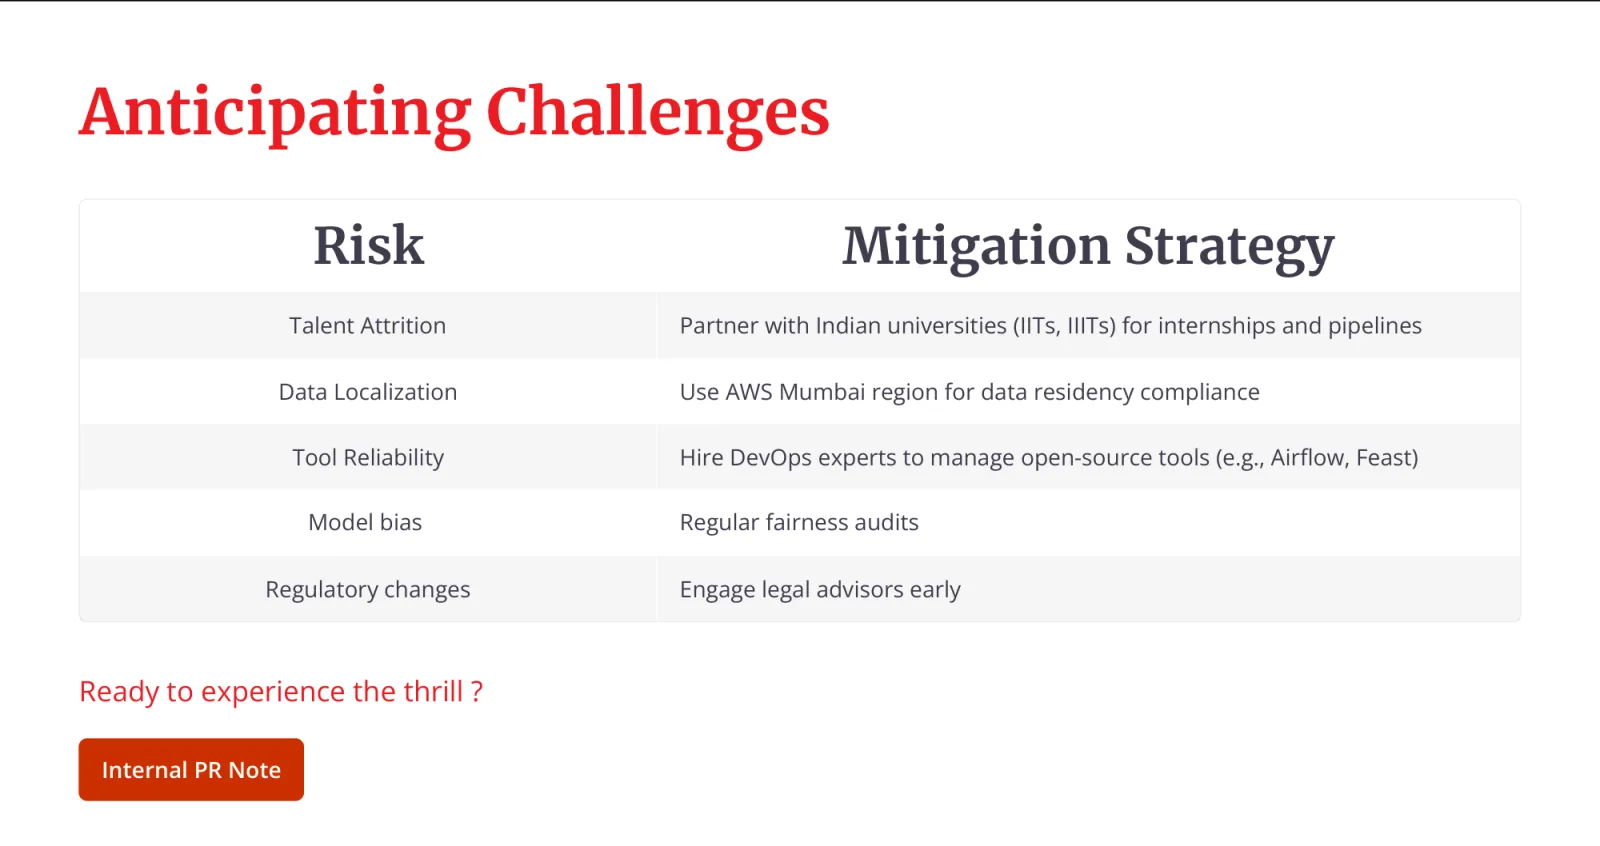
Slide 13, Anticipating Challenges, a table of risks and mitigation strategies. Talent attrition: partner with Indian universities, IITs and IIITs, for internships and pipelines. Data localization: use the AWS Mumbai region for data residency compliance. Tool reliability: hire DevOps experts to manage open-source tools such as Airflow and Feast. Model bias: regular fairness audits. Regulatory changes: engage legal advisors early. Below the table, the line Ready to experience the thrill? and a button to the internal PR note.
Slide 13Open in deck (opens in a new tab)

Launch note

Internal PR note for v1, from the appendix

Launching Dream11's AI-Powered ML Platform - Your Gateway to Smarter Fantasy Sports!

Hi Team, we're thrilled to announce the launch of Dream11's in-house ML Platform, designed to supercharge your workflows and transform user experiences! Get started: explore tutorials and sandbox environments at [internal link]. Training sessions start next week!

  • Build models 70% faster using AutoML with sport-specific algorithms
  • Monitor system health, fraud patterns and user engagement live
  • Shared workspaces for data scientists, developers and business teams

For data teams

Focus on innovation, not infrastructure.

For developers

Scale seamlessly during IPL peaks.

For marketing and sales

Target users with hyper-personalized campaigns.

The PR note is part of the interview case, written as if the platform had launched. Nothing in this deck describes what Dream11 built.
Growth areas

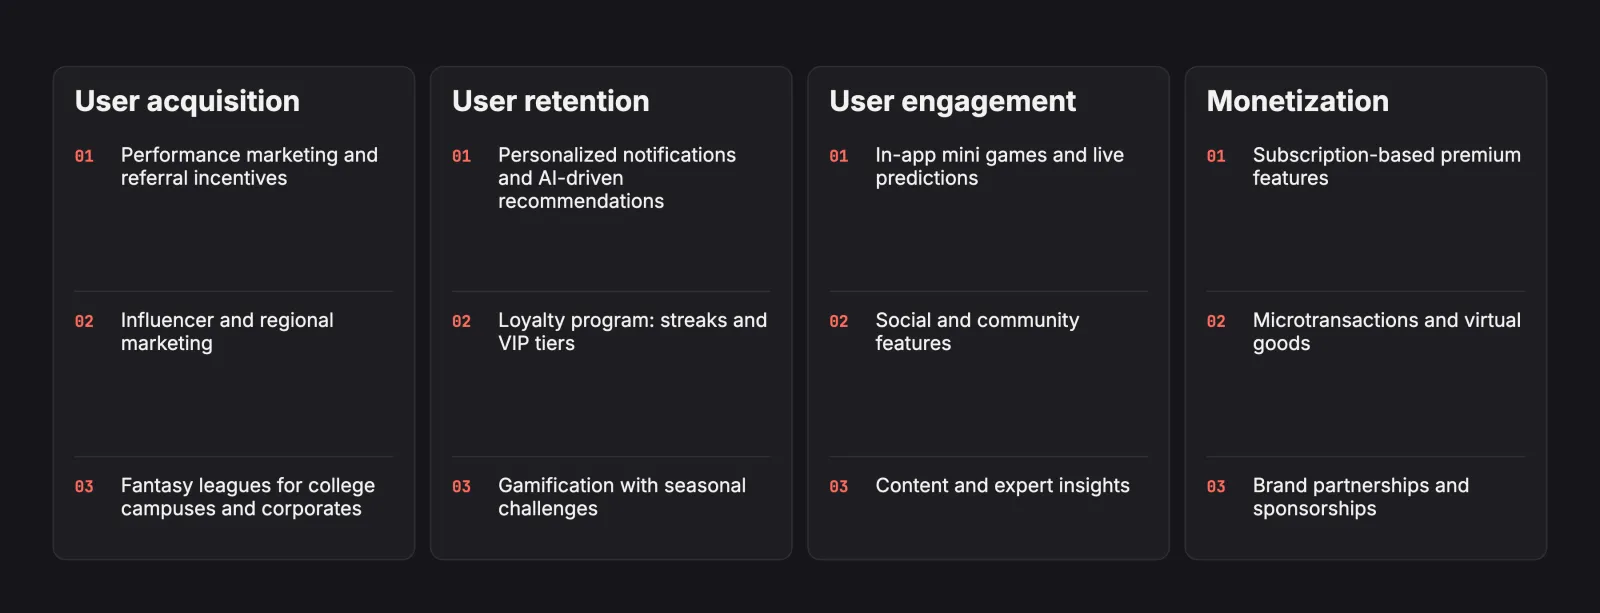
Four cards of growth ideas, three in each. User acquisition: Performance marketing and referral incentives; Influencer and regional marketing; Fantasy leagues for college campuses and corporates. User retention: Personalized notifications and AI-driven recommendations; Loyalty program: streaks and VIP tiers; Gamification with seasonal challenges. User engagement: In-app mini games and live predictions; Social and community features; Content and expert insights. Monetization: Subscription-based premium features; Microtransactions and virtual goods; Brand partnerships and sponsorships.
Growth ideasIdeas listed at the end of the appendix, beyond the pitch itself. Each heading has two examples there.

Original artifacts3

The sources, as written. The deck is the public copy: its closing slide, which holds only contact details, is left out.

Download the original documents (zip)
Next in Product & Strategy · 7 of 8Vyry Quest ActivationA campus quest that delights late: peer notes, a ranked fix list, a PRD and a hotspot visit.Next project

Sections 9

Original artifacts3